One of the issues I spend the most time on is trying to understand just why people deny the findings of science and adhere to a falsifiable belief. Of course, I'm not the only one. This is a topic of widespread concern and study. The amazing thing is to see how far people will go to support their beliefs.
As a scientist, it's a slam-dunk to realize what is happening with climate change. Read the science and there is only one, inescapable conclusion - manmade emissions are changing the world's climate. Yes, the science is most definitely settled. So, why is it some people go to incredible lengths to deny this? If you think I'm exaggerating, take a look at the submissions to the Global Warming Skeptic Challenge. Some of them go beyond bizarre. Without paraphrasing, I had people tell me if the science disagreed with their conclusion then the science had to be thrown out. They were right and any science to the contrary had to be wrong. Wow!
Of course, climate change is not the only issue where people deny the science. Just take a look at this article here about the anti-vaxxers. (I find it interesting how he describes bloodletting as something from the past. I have a genetic condition (hemochromatosis) that requires me to go in for bloodletting on occasion, except we call it phlebotomy nowadays.)
So, what makes someone think like that? If I knew the answer I would probably be in line for an award of some kind, a Nobel at the very least. Many people have, and are, working to solve this problem and it isn't likely to be me that finds it. But, that won't stop me from thinking about it and I think a book I read recently gives me a clue.
I read Ken Follet's book, Fall of Giants, this winter. I'm a fan of his writing and thought Pillars of the Earth and World Without End were magnificent. I've been waiting to read the first book in this new series until it was all out in print, which happened last fall. (I read a very good book twenty years ago that left me anxious for the rest of the series. I'm still waiting for the rest of the Game of Thrones series. Yes, twenty years. I just put new volumes on the shelf and will read them all once it's done.) If you're not familiar with Fall of Giants, it is a historical fiction set in Europe and the U.S. and concerns World War I. One of the amazing things about the Great War that others have discussed, and Follet brings out very well, is how the people followed the royalty almost without question. The empirical leaders of Great Britain, Germany, Austria-Hungary and Russia made unbelievably bad decisions and they were implemented. Not just because followers were afraid to stand up to the royals (there was some of that), but also because they believed in their respective leaders so much they would do anything asked of them.
These people identified with their leaders so strongly their identities became those of their leaders. By following a great leader they themselves became great. In their minds, they became more privileged, more royal, because of who they identified with. They were better than those people over in that other country who followed some other royalty. When their leader made a great decision the followers were also great because that was their identity. Consequently, any criticism of their leaders became criticism of themselves. Thus, when the leaders made bad decisions, they were incapable of seeing that and blindly implemented the commands. Even joyfully. Let's all sing as we march off to war.
Now, we have a similar situation with science denialism. The fact we don't have battlefields covered with dead bodies doesn't mean the number of casualties and the overall cost will not be the same given enough time. It is odd and disturbing to see how people obediently follow entities such as the Heartland Institute, WUWT!, Roy Spencer, Christopher Monckton and all the rest. People still blindly follow them, even when it is shown that these entities are lying and are being paid to lie. It is the same blind loyalty seen with sports teams. "It is my team and I'm going to support them, no matter what!"
I remember having a conversation (all right, it was an argument) with a guy in 1987 about the dangers of cigarette smoking. I claimed science showed smoking was hazardous and the other guy claimed it was harmless. It was a short discussion because the guy got so angry with me I thought he was going to physically attack me. The interesting thing is he wasn't even a smoker. Of course, we know how the smoking issue turned out. I don't know what ever happened to that guy, but I wonder what his reaction was when it finally came out the tobacco companies knew all along and were lying to us.
So, where am I going with this thought?
I think many people have come to identify with the denier industry and will follow it, not because they think they are right, but because the identity of the industry has become their own. If the denier industry is wrong, then they are weak and vulnerable, at least in their own eyes. Likewise, if the industry is right, then they are strong and somehow superior. What could give someone a bigger feeling of superiority than to be able to say they can prove all of the scientists in the world wrong? Oh, and all of you people in that other group that doubt me are inferior. Sucks for you.
What that means is the only way to break the climate change gridlock is to discredit the industry. You have to make people believe that following the industry gives them a poor identity and following the science gives them a good identity.
Now, how do you go about doing that? Beats me.
Tuesday, March 31, 2015
Friday, March 27, 2015
Models and Climate Variability
One of the most common, and least credible, complaints I hear from deniers is that climate change is not real because the models all fail. This is both false and a false argument.
Let me address the false argument first. In fact, I have addressed this in some detail before, but it's worth repeating. A model is a mathematical representation of a real phenomenon. The real thing remains unchanged whether the model is accurate or not. If we get the model correct, the real world is the same. If we get it wrong, the real is still the same. The accuracy of models has no bearing at all on the reality of climate change.
And, climate models and climate science are not the same thing. Models are merely one tool among many we use. Besides models, there are satellites, thermometers, aircraft, ice cores, mud cores, coral cores, tree rings, buoys, radar and much more.
Besides that, the fact is, models are quite accurate and getting better every year. Here is just one discussion on the topic.
I came across a paper from last December that applied to this discussion: Evaluating Modes of Variability in Climate Models, Adam S. Phillips, Clara Deser and John Fasullo, Eos, Vol. 95, No. 49, 9 December 2014. This paper describes how the National Center for Atmospheric Research (NCAR) has developed a Climate Variability Diagnostic Package (CVDP). This package uses metrics for climate variability and applies these metrics to model outputs to see how well they perform in an effort to evaluate internal variability of the models. You can go to the NCAR website and see some of the results. What they show is the models are doing pretty well. Here is an example:
 |
| Source: NCAR |
This is an evaluation of 42 separate outputs for models evaluating the December-January-February sea surface temperature change for the period of 1900 - 2005. Red shows the areas where the models were the least accurate and blue the areas where they were most accurate.
As you can see, they did very well. There are numerous other examples on the website.
No, this will not get any denier to stop saying models aren't accurate, but it is one more clear example of how they simply ignore the reality.
Wednesday, March 25, 2015
Arctic Sea Ice Minimum Maximum
It has been widely reported the Arctic sea ice extent this year was not only a record low for a maximum extent, but it also came very early. What does this mean? Truthfully, not all that much by itself. After all, some year has to have the minimum maximum and there is a lot fluctuation from one year to the next.
Just what does it mean to say, 'sea ice extent' anyway? The answer to that question reveals why it is so difficult to model the ice extent. The accepted standard for sea ice extent is the area of the ocean that has at least 15% ice cover. Let's do some math and you can see the problem.
Suppose we have, just for example, 1000 square kilometers of 100% ice coverage. If 25% of that ice melts, we now have 1000 square kilometers of 75% ice coverage. Under the 15% rule, they are the same. Now, let's suppose the wind and currents break this up and expands that ice into an area of 1500 square miles. This area will now have an average ice cover of 50%. Under the 15% rule, we have seen an increase in ice extent of 50% even though we have 25% less ice.
The reverse is also true. If we had started with the 1500 square kilometers of 50% coverage, wind and currents could compress this ice into an area of 1000 square kilometers and 75% coverage. This is a reduction in sea ice extent, even though we have the same amount of ice.
The bigger question is, how does this fit in the long-term trend and that is very revealing.
Here is the sea ice trend for March (through 2014), the normal month of maximum extent:
Now we're talking about some issues. Very clearly, the maximum extent that occurs every year is trending down, even with the annual fluctuation. March 2015 will be even lower than the lowest point on this graph, well below the trend line.
Let's compare a few other graphics.
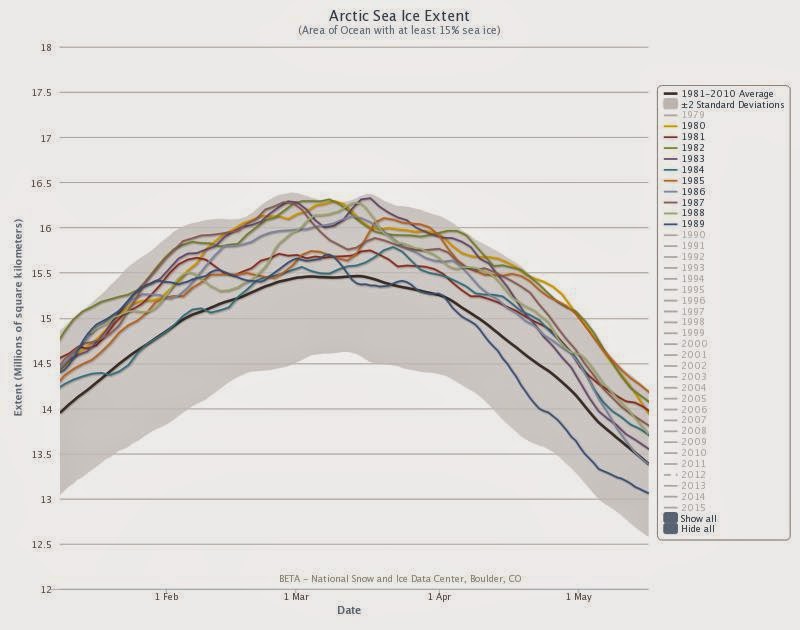
This is a plot of the winter Arctic sea ice extent (including the maximum extent) for the years of 1980 through 1989. The dark solid line in the middle is the 1981 - 2010 average. Almost every year was above the average line for the entire period plotted.:
This is the same plot for the years of 1990 through 1999. Now we see several years plotting below the average line.:
Now, compare to this plot showing the years of 2006 through 2015 (the incomplete line on the bottom). Now, the extent plots below the average for almost all points.:
When you compare these three plots you can see that the extent is decreasing rapidly. Not only that, we can see there were places that routinely had ice cover in 1980 that have not seen ice for decades.
Now, that statement about this being the minimum maximum means something.
And, keep in mind this is what is happening in the dark of the winter. There can be no mistaken belief it is caused by some reduction in sunlight. There is only one possible explanation - the Arctic Region is getting warmer, even in the winter time. Some combination of warmer air and warmer seas is keeping the ice from forming the way it used to.
By the way, in the same vein, I read an article describing how the snow in Wyoming is melting earlier every year and is now melting 16 days earlier than it was in the 1970s.
Coincidence?
Just what does it mean to say, 'sea ice extent' anyway? The answer to that question reveals why it is so difficult to model the ice extent. The accepted standard for sea ice extent is the area of the ocean that has at least 15% ice cover. Let's do some math and you can see the problem.
Suppose we have, just for example, 1000 square kilometers of 100% ice coverage. If 25% of that ice melts, we now have 1000 square kilometers of 75% ice coverage. Under the 15% rule, they are the same. Now, let's suppose the wind and currents break this up and expands that ice into an area of 1500 square miles. This area will now have an average ice cover of 50%. Under the 15% rule, we have seen an increase in ice extent of 50% even though we have 25% less ice.
The reverse is also true. If we had started with the 1500 square kilometers of 50% coverage, wind and currents could compress this ice into an area of 1000 square kilometers and 75% coverage. This is a reduction in sea ice extent, even though we have the same amount of ice.
The bigger question is, how does this fit in the long-term trend and that is very revealing.
Here is the sea ice trend for March (through 2014), the normal month of maximum extent:
 |
| Source: NSIDC |
Let's compare a few other graphics.
This is a plot of the winter Arctic sea ice extent (including the maximum extent) for the years of 1980 through 1989. The dark solid line in the middle is the 1981 - 2010 average. Almost every year was above the average line for the entire period plotted.:
 |
| Source: NSIDC |
This is the same plot for the years of 1990 through 1999. Now we see several years plotting below the average line.:
 |
| Source: NSIDC |
Now, compare to this plot showing the years of 2006 through 2015 (the incomplete line on the bottom). Now, the extent plots below the average for almost all points.:
 |
| Source: NSIDC |
When you compare these three plots you can see that the extent is decreasing rapidly. Not only that, we can see there were places that routinely had ice cover in 1980 that have not seen ice for decades.
Now, that statement about this being the minimum maximum means something.
And, keep in mind this is what is happening in the dark of the winter. There can be no mistaken belief it is caused by some reduction in sunlight. There is only one possible explanation - the Arctic Region is getting warmer, even in the winter time. Some combination of warmer air and warmer seas is keeping the ice from forming the way it used to.
By the way, in the same vein, I read an article describing how the snow in Wyoming is melting earlier every year and is now melting 16 days earlier than it was in the 1970s.
Coincidence?
Beijing to Close All Coal-Fired Power Plants
Some times I see an article that makes me go 'Whoa!' This was one of them. Beijing, the capital of China, is closing the last four remaining coal-fired power plants by the end of next year. This move is a result of China acknowledging the air-pollution and climate change problems we are facing. This one move will leave over 9 million tons of coal in the ground every year. The larger goal for the country is to reduce coal consumption by 13 million tons per year by 2017.
I hope it hits the Koch Brothers right in the pocket book.
I hope it hits the Koch Brothers right in the pocket book.
Tuesday, March 24, 2015
Future of California Water Looks Bleak
As you have probably heard, the snowpack in the Sierra Nevada mountains this winter is running at merely 19% of the long-term average. Not good for a state that gets 30% of its water from snow runoff and is already in a prolonged drought. But stay tuned. This is just the beginning.
The future of the snowpack in the western U.S. was examined in the paper Extent of the rain-snow transition zone in thewestern U.S.under historic and projected climate, by P. Zion Klos, Timothy E. Link and John T. Abatzoglou, DOI: 10.1002/2014GL060500, Geophysical Research Letters, Volume 41, Issue 13, pages 4560–4568, 16 July 2014. Their conclusion?
The winter recreation industry for California will be only a part of that, but even a small part would be a lot of jobs and money.
And, let's not mention the hit the environment and ecology will take.
Sure, there will be years that see big snowfalls. But, the overall average does not look good.
The future of the snowpack in the western U.S. was examined in the paper Extent of the rain-snow transition zone in thewestern U.S.under historic and projected climate, by P. Zion Klos, Timothy E. Link and John T. Abatzoglou, DOI: 10.1002/2014GL060500, Geophysical Research Letters, Volume 41, Issue 13, pages 4560–4568, 16 July 2014. Their conclusion?
At broad scales, these projections indicate an average 30% decrease in areal extent of winter wet-day temperatures conducive to snowfall over the western United States.A 30% decrease? That leaves 70% of 19%, which comes out to be 13.3%! Yikes! That would translate into a loss of over 15% of their water from that one source alone. And, don't forget the other ramifications, such as the hit to the winter recreation industry. How many jobs does California have in that one industry? I couldn't find that specific number, but I found the numbers for the entire outdoor recreation industry for the whole country:
- 6.1 million American jobs- $646 billion in outdoor recreation spendingeach year- $39.9 billion in federal tax revenue- $39.7 billion in state/local tax revenue
The winter recreation industry for California will be only a part of that, but even a small part would be a lot of jobs and money.
And, let's not mention the hit the environment and ecology will take.
Sure, there will be years that see big snowfalls. But, the overall average does not look good.
Monday, March 23, 2015
Donner Pass
I thought I would pass this on to anyone that might be interested. It's a picture of Donner Pass, taken on January 31, 2015. Donner Pass is infamous for the plight of the Donner Party, a group of pioneers moving west. They got stuck in the mountains due to the heavy snowfall and had to spend the winter in the mountains. They ran out of supplies and, at least some of them, resorted to eating the party members that had already died.
This winter, Donner Pass, the same one that trapped those people with heavy snow, is completely snow free. In the linked image above you can see the snow line on the mountains in the distance.The latest report by the California Department of Water Resources from March 3 found the snowpack to be only 19% of the long-term average.
The first time I went through Donner Pass was the winter of 1982 and I barely made it. There was a lot of snow on the ground and more was falling. The Interstate was closed within a few hours of my passing through. Not any more.
Sunday, March 22, 2015
Disappearing Fog Another Factor in California
As we all know, California is having a epic drought while also experiencing historically high temperatures. The high temperatures are compounding the drought by increasing the rate of evaporation. One of the factors involved that is often overlooked is the rate of fog. Fog works to cool the surface by providing shade until it is burned off. Less fog means the sunlight reaches the ground more, resulting in more heating. As it turns out, the amount of fog in California is decreasing.
It has already been noted how California's famous Tule fog is becoming increasingly rare. This is the thick, winter fog that can blanket the central region so thickly it actually waters the plants. But, fog in general is decreasing across the state. Over the course of the 20th century, coastal summertime fog worldwide was reported to decrease by 33%. California, in particular, has experienced a century-long decline in coastal fog.
What is the long-term outlook? That is not clear (foggy? Sorry). Warm ocean surface temperatures lead to a decrease in fog. But it is not certain the coastal waters will get warmer, even when the ocean overall is getting warmer, due to upwelling. It is possible the medium-term amount of fog will stay constant, or decrease slightly. But, the long-term outlook has to be bleak, even with upwelling. The depths are getting warmer and eventually the upwelling water will be too warm to lead to fog.
So, as the crops suffer the loss of the cooling fog (the grapes for one love fog), the rest of the state will also suffer due to the reduction in the shading, leading to higher surface temperatures, leading to greater evaporation, leading to even higher temperatures.
But, at least there will be fewer fog delays at the airports.
Saturday, March 21, 2015
February 2015 Was Second Warmest Ever Recorded
The warming trend continues. NOAA released it's State of the Climate report for February and announced February 2015 was the second warmest February ever recorded,
Our 2015 count looks like this:
February was the second hottest February on record;
January was the second hottest January on record.
So far, 2015 has two second hottest months ever recorded.
For the last 12 months, the tally is:
February 2015 was the second hottest February ever recorded;
January 2015 was the second hottest January ever recorded;
December 2014 was the hottest December ever recorded;
November 2014 was the 7th hottest November ever recorded;
October 2014 was the hottest October ever recorded;
September 2014 was the hottest September ever recorded;
August 2014 was the hottest August ever recorded;
July 2014 was the fourth hottest July ever recorded;
June 2014 was the hottest June ever recorded;
May 2014 was the hottest May ever recorded;
April 2014 tied 2010 as the hottest April ever recorded;
March 2014 was the fourth hottest March ever recorded;
So, let's see what the score is for the last 12 months: one 7th hottest month, two 4th hottest months, two 2nd hottest months and seven hottest months ever.
Nine of the last twelve months was either the hottest or second hottest ever recorded.
The combined average temperature over global land and ocean surfaces for February 2015 was the second highest for February in the 136-year period of record, at 0.82°C (1.48°F), above the 20th century average of 12.1°C (53.9°F). The warmest February occurred in 1998, which was 0.86°C (1.55°F) above average. Nine of the past 12 months have been either warmest or second warmest on record for their respective months (March and July 2014 were each fourth warmest, while November was seventh warmest).
Our 2015 count looks like this:
February was the second hottest February on record;
January was the second hottest January on record.
So far, 2015 has two second hottest months ever recorded.
For the last 12 months, the tally is:
February 2015 was the second hottest February ever recorded;
January 2015 was the second hottest January ever recorded;
December 2014 was the hottest December ever recorded;
November 2014 was the 7th hottest November ever recorded;
October 2014 was the hottest October ever recorded;
September 2014 was the hottest September ever recorded;
August 2014 was the hottest August ever recorded;
July 2014 was the fourth hottest July ever recorded;
June 2014 was the hottest June ever recorded;
May 2014 was the hottest May ever recorded;
April 2014 tied 2010 as the hottest April ever recorded;
March 2014 was the fourth hottest March ever recorded;
So, let's see what the score is for the last 12 months: one 7th hottest month, two 4th hottest months, two 2nd hottest months and seven hottest months ever.
Nine of the last twelve months was either the hottest or second hottest ever recorded.
Florida Threatened by That Which Cannot Be Mentioned
Florida Governor Rick Scott is such a intense science-denier that he has instructed government employees they are not permitted to use the phrases 'climate change,' 'global warming,' and sea-level rise. One employee who failed to follow this rule was forced to take a leave of absence and was not permitted to return to work until he underwent a mental health evaluation to determine his 'fitness for duty.'
For the record, I contacted Governor Scott's office and asked for comments. They did not respond.
Unfortunately, the laws of physics don't really care what Rick Scott thinks - nature will do it's thing anyway. The sea level has risen about 6 inches since the 1960s and that is enough to swamp coastal areas during storms and even during high tide in some areas. The freshwater aquifers are experiencing sea water intrusion due to overuse and rising sea levels. Beaches are eroding and require expensive maintenance. Storms are becoming more frequent and more severe. Additionally, rising sea levels will make Florida more vulnerable. Climate change has come to Florida and is hitting it hard. That is what is going on right now, not what will be coming in the future. And, for some reason, Governor Scott would rather see his state and his constituents suffer from the effects of climate change than to even use the words.
Oh, and FEMA will not provide federal funds unless a state disaster preparedness plans address climate change. Oops. He may not be a scientists, but the money issue has been settled.
I'm wondering, is stupidity an impeachable offense?
He may not be a scientist, but that hasn't stopped him from proving he's a jackass. Now, Floridians are paying the price. Which is kind of appropriate, since they're the ones who voted him into office.
Question to Deniers: Why Aren't You as Smart as a Six-Year Old?
Deniers love to use that ridiculous line - I'm not a scientist..., and then they proceed to demonstrate what a jackass they are by claiming to be smarter than all of the climate scientists in the world combined.
Well, here's a video by a six-year old on climate change. If he can figure it out, why can't you?
Well, here's a video by a six-year old on climate change. If he can figure it out, why can't you?
Friday, March 20, 2015
Shameless Self Plug - That Which Maddens and Torments
One of the many projects I have been involved with over the last nine months is my first fiction novel. I have published two nonfiction books, but this is my first work of fiction.
I am pleased to announce That Which Maddens and Torments is now available in hard copy form from Amazon for $17.99 and Barnes & Noble as an ebook for the Nook at $2.99. It should be available for the Kindle within a few days.
Readers of this blog might enjoy the fact the climate change denier industry is the villain in the story. Having said that, this is merely a book for entertainment and I'm not trying to send a message. I needed a villain and had an easy one right in front of me.
I am already working on my next fiction novel, as well as a nonfiction book on the global warming challenge. You can follow my books at chriskeatingauthor.com.
I hope you read my book and enjoy it. I would be interested in hearing what you think.
Tuesday, March 17, 2015
Based on the Evidence-Cardiac and Orthopedic Procedures To Avoid
Here are the latest conclusions from the 2015 Road to Rightcare by the doctor-driven Lown Institute, which aims to prevent unnecessary and ineffective procedures and enhance patient health. To quote one of the conference speakers, America Bracho, M.D., "Health is more than the absence of disease." Become a more powerful practitioner and patient by signing-up for the Rightcare newsletter and to learn more about the practices this multi-disciplinary group is promoting.
Cardiac Care
Percutaneous Coronary Intervention or Angioplasty
As incredible as it may seem there are thousands of unnecessary and non-beneficial cardiac procedures performed each year in the U.S. Here are the summary notes from the Lown Conference Cardiac Care presentation by Dr. William Boden, FACC, FAHA, Professor of Medicine, Albany Medical College and Chief of Medicine at Stratton VA Medical Center. For patients with chronic and stable angina, the benefits of percutaneous coronary intervention, which involves working a balloon up through the femoral artery to unblock the clogs in the heart, are unclear. In the past, PCI was done for patients who had high risk of death due to a heart attack. Because angioplasty is less invasive than coronary artery bypass graft or CABG, it has become more popular. A randomized trial of 1,018 patients comparing PCI or angioplasty to treatment with medication, was conducted in the United Kingdom and Ireland. Of the 504 patients whom underwent PCI, 11 died, compared to the 7 of the 514 randomized patients, whom were treated with medication. Additionally, 21 of the PCI patients had heart attacks compared to 10 of those on medication. These results are quite astounding, because the benefits of not having the surgery are almost twice (1.92 in relative risk variance) what the surgical intervention produced. https://www.dropbox.com/s/nxkqfsnlmjx5zse/Lown%20PCI%20in%20SIHD%20Workshop_Boden_021615.ppt?dl=0
Orthopedic Surgery
There are 800,000 joint replacements done in the U.S. every year by the 20,000 orthopedic surgeons, who are the highest income earners of all clinicians, averaging $413,000 annually, as cited by Dr. Boniface, Clinical Professor and Chairman of Orthopedic Surgery at Northeastern Ohio Medical University. Here is the alphabetized list of commonly performed unnecessary and often ineffective orthopedic procedures as identified by James Rickert, M.D. President of The Society for Patient-Centered Orthopedics, Thomas J. Grogan, M.D. Orthopedic Surgeon, Thomas Boniface, M.D., NEOMED, and Rob Rutherford, M.D. Clinical Instructor, University of Washington:
Adolescent Clavicle Fractures and Surgical Repair
Traditionally family practitioners, which would be pediatricians for adolescents, treated clavicle fractures by deploying a sling to prevent stress on the bone while it healed. Why is surgery being done on so many clavicles which heal on their own?
Anterior Cruciate Ligament or ACL Tear Surgery
Most of us have heard of the "ACL injury" as it is the de rigueur for weekend warriors. However, clinically, many more people are having this surgery than for whom it was intended to treat. In 2008, there were 100,000 ACL surgical repairs and now there are 200,000. In Unraveling U.S. Healthcare-A Personal Guide, I devote a chapter to surgical tips for consumers and why I chose non-surgical treatment for my ACL tear. In fact, a 2013 article published in the American Journal of Sports Medicine demonstrates that patients who opted for a nonsurgical treatment had the same rate of return to sports activities. The Scandinavian Journal of Medicine and Science in Sports published a study in 2009, which found that 51% of the patients which did not have the ACL repair operation performed better on two of the four, single-legged hop tests. And for those of you who need more evidence, the British Journal of Medicine also published a study in 2013, which showed that ACL reconstruction and rehabilitation did not produce better results than initial rehabilitation and postponement of surgery, after five years of observation.
http://www.amazon.com/Unraveling-U-S-Health-Care-Personal/dp/1442222972#
Partial Meniscectomy for Arthritic Knees
Meniscectomy was studied in a randomized controlled trial of 351 patients, where physical therapy was compared to the surgical repair technique of the meniscectomy and found equal results for pain relief and functional status were achieved with physical therapy. The randomized controlled trial means that patients were chosen at random and followed for the same period of time, using the same measures to assess the effectiveness of the treatment. Conclusion-if you have arthritis this procedure won't help you.
Rotator Cuff Tears and Surgical Intervention
Rotator cuff tears are often asymptomatic, which means the patient is not aware there is a problem and is not experiencing any restrictions. A 2010 article in the Journal of Shoulder and Elbow Surgery found that 20.7% of the general population had rotator cuff tears and asymtomatic tears were twice as common as those in patients with symptoms. This condition, which is an aspect of normal aging is found via the ubiquitous MRI. Despite this evidence, there are 600,000 of these surgeries in the U.S. each year. To put it bluntly, medical evidence shows that physical therapy can be just as effective to treat this problem, and should only be provided to patients who actually have symptoms.Risks of a surgical repair to the rotator cuff include; bleeding, infection, stiffness, re-rupture of the tear, neurovascular injury, and unrelieved pain. For patients whom are 60+ years, a non invasive treatment is preferential to a surgical repair. As the gold-standard randomized controlled trial showed, the results are the same with our without surgery.
Vertebroplasty-A Spinal Treatment
Vertebroplasty is a heavily marketed orthopedic procedure which involves injecting cement into the center of a fractured vertebra. It is used for compression fractures of the spine. The British Medical Journal did a large randomized controlled trial and found there was no evidence this procedure provided any medical benefit. One fourth of women over age 50 have one or more fractures. The rate of vertebroplasty has increased from 45 to 87 cases per 100,000 patients in the Medicare population. Though this treatment is marketed as providing quick pain relief, scientific studies show there is a risk of increased compression fracture, dural tears, infections, cement migration, and the need for additional surgery due to radiculopathy. In a 2009 study published in the New England Journal of Medicine, pain cessation for patients treated with vertebroplasty were similar to those in the control group who did not have the surgery. No commercial entity paid for any of the materials in this study and the costs of the surgery were billed to insurance companies. In the industry funded studies, the cementing procedures is typically compared to sham procedures and not to nonsurgical interventions.Conclusion-This is yet another back surgery which has elusive results-Medicare needs to review this. https://www.dropbox.com/s/pb7arzvpl5garkf/LownBibliography1-1.docx?dl=0
How Changes in Health Policy at the Centers for Medicare and Medicaid Can Improve Care
In the three days I spent at the Lown Care Conference it was obvious the physicians all had ideas on how changes in our national health care policy could drive health care practices and result in better patient care and a reduction in ineffective treatments. Here are their observations on ways to improve health care quality in the nation:
Rhode Island has sparked a unique health effort to meet community needs in under-served areas by creating community centers which incorporate fitness centers, achieve critical mass in community enrollment through representation of community members, provide urgent care services at the center, offer home health visits, and deploy school-based health programs. They plan to fund it through taxation of health services. University of Minnesota professor, Bill Doherty has co-authored the Citizen Health Care Initiative, which aims to engage communities, families, and individual patients to participate and generate health improvements. This community model attempts to instill healthier perspectives and behaviors instead of waiting for major medical interventions at the hospital. Washington State has Healthier Washington, a grant funded project, which is exploring everything from reimbursement and design changes to the state Medicaid plan, to community assessment, and resourcing of health care needs.The real question is whether any of these ambitious programs will be able to improve health. My money is on the Rhode Island community center model.
Have I met all of my health goals since I returned from the conference-no, but I am making progress and just remember Winston Churchill's quote, "You can always count on Americans to do the right thing, after they have tried everything else." And this is the healthpolicymaven signing off encouraging you to think about your health and ask questions before you pursue health treatments.
This article was written by Roberta E. Winter, MHA, MPA, an independent health care analyst and writer and may be shared with others. It is not meant to give medical advice, but to highlight what the experts and the medical evidence show for common surgical procedures which are over utilized in the United States. The article is not a comprehensive review of unnecessary surgeries, especially in cardiac care, because it was written for the layperson.
Cardiac Care
Percutaneous Coronary Intervention or Angioplasty
As incredible as it may seem there are thousands of unnecessary and non-beneficial cardiac procedures performed each year in the U.S. Here are the summary notes from the Lown Conference Cardiac Care presentation by Dr. William Boden, FACC, FAHA, Professor of Medicine, Albany Medical College and Chief of Medicine at Stratton VA Medical Center. For patients with chronic and stable angina, the benefits of percutaneous coronary intervention, which involves working a balloon up through the femoral artery to unblock the clogs in the heart, are unclear. In the past, PCI was done for patients who had high risk of death due to a heart attack. Because angioplasty is less invasive than coronary artery bypass graft or CABG, it has become more popular. A randomized trial of 1,018 patients comparing PCI or angioplasty to treatment with medication, was conducted in the United Kingdom and Ireland. Of the 504 patients whom underwent PCI, 11 died, compared to the 7 of the 514 randomized patients, whom were treated with medication. Additionally, 21 of the PCI patients had heart attacks compared to 10 of those on medication. These results are quite astounding, because the benefits of not having the surgery are almost twice (1.92 in relative risk variance) what the surgical intervention produced. https://www.dropbox.com/s/nxkqfsnlmjx5zse/Lown%20PCI%20in%20SIHD%20Workshop_Boden_021615.ppt?dl=0
Orthopedic Surgery
There are 800,000 joint replacements done in the U.S. every year by the 20,000 orthopedic surgeons, who are the highest income earners of all clinicians, averaging $413,000 annually, as cited by Dr. Boniface, Clinical Professor and Chairman of Orthopedic Surgery at Northeastern Ohio Medical University. Here is the alphabetized list of commonly performed unnecessary and often ineffective orthopedic procedures as identified by James Rickert, M.D. President of The Society for Patient-Centered Orthopedics, Thomas J. Grogan, M.D. Orthopedic Surgeon, Thomas Boniface, M.D., NEOMED, and Rob Rutherford, M.D. Clinical Instructor, University of Washington:
Adolescent Clavicle Fractures and Surgical Repair
Traditionally family practitioners, which would be pediatricians for adolescents, treated clavicle fractures by deploying a sling to prevent stress on the bone while it healed. Why is surgery being done on so many clavicles which heal on their own?
Anterior Cruciate Ligament or ACL Tear Surgery
Most of us have heard of the "ACL injury" as it is the de rigueur for weekend warriors. However, clinically, many more people are having this surgery than for whom it was intended to treat. In 2008, there were 100,000 ACL surgical repairs and now there are 200,000. In Unraveling U.S. Healthcare-A Personal Guide, I devote a chapter to surgical tips for consumers and why I chose non-surgical treatment for my ACL tear. In fact, a 2013 article published in the American Journal of Sports Medicine demonstrates that patients who opted for a nonsurgical treatment had the same rate of return to sports activities. The Scandinavian Journal of Medicine and Science in Sports published a study in 2009, which found that 51% of the patients which did not have the ACL repair operation performed better on two of the four, single-legged hop tests. And for those of you who need more evidence, the British Journal of Medicine also published a study in 2013, which showed that ACL reconstruction and rehabilitation did not produce better results than initial rehabilitation and postponement of surgery, after five years of observation.
http://www.amazon.com/Unraveling-U-S-Health-Care-Personal/dp/1442222972#
Partial Meniscectomy for Arthritic Knees
Meniscectomy was studied in a randomized controlled trial of 351 patients, where physical therapy was compared to the surgical repair technique of the meniscectomy and found equal results for pain relief and functional status were achieved with physical therapy. The randomized controlled trial means that patients were chosen at random and followed for the same period of time, using the same measures to assess the effectiveness of the treatment. Conclusion-if you have arthritis this procedure won't help you.
Rotator Cuff Tears and Surgical Intervention
Rotator cuff tears are often asymptomatic, which means the patient is not aware there is a problem and is not experiencing any restrictions. A 2010 article in the Journal of Shoulder and Elbow Surgery found that 20.7% of the general population had rotator cuff tears and asymtomatic tears were twice as common as those in patients with symptoms. This condition, which is an aspect of normal aging is found via the ubiquitous MRI. Despite this evidence, there are 600,000 of these surgeries in the U.S. each year. To put it bluntly, medical evidence shows that physical therapy can be just as effective to treat this problem, and should only be provided to patients who actually have symptoms.Risks of a surgical repair to the rotator cuff include; bleeding, infection, stiffness, re-rupture of the tear, neurovascular injury, and unrelieved pain. For patients whom are 60+ years, a non invasive treatment is preferential to a surgical repair. As the gold-standard randomized controlled trial showed, the results are the same with our without surgery.
Vertebroplasty-A Spinal Treatment
Vertebroplasty is a heavily marketed orthopedic procedure which involves injecting cement into the center of a fractured vertebra. It is used for compression fractures of the spine. The British Medical Journal did a large randomized controlled trial and found there was no evidence this procedure provided any medical benefit. One fourth of women over age 50 have one or more fractures. The rate of vertebroplasty has increased from 45 to 87 cases per 100,000 patients in the Medicare population. Though this treatment is marketed as providing quick pain relief, scientific studies show there is a risk of increased compression fracture, dural tears, infections, cement migration, and the need for additional surgery due to radiculopathy. In a 2009 study published in the New England Journal of Medicine, pain cessation for patients treated with vertebroplasty were similar to those in the control group who did not have the surgery. No commercial entity paid for any of the materials in this study and the costs of the surgery were billed to insurance companies. In the industry funded studies, the cementing procedures is typically compared to sham procedures and not to nonsurgical interventions.Conclusion-This is yet another back surgery which has elusive results-Medicare needs to review this. https://www.dropbox.com/s/pb7arzvpl5garkf/LownBibliography1-1.docx?dl=0
How Changes in Health Policy at the Centers for Medicare and Medicaid Can Improve Care
In the three days I spent at the Lown Care Conference it was obvious the physicians all had ideas on how changes in our national health care policy could drive health care practices and result in better patient care and a reduction in ineffective treatments. Here are their observations on ways to improve health care quality in the nation:
- United States healthcare is being pushed toward a "risk-based" model which means identifying the most efficacious treatments and creating cost savings is critical. One way to achieve this is through bundling payments or reimbursements for clinicians and health care facilities. This would create less of a financial impetus to perform the highest reimbursement surgery as opposed to the treatment most appropriate for the patient.
- CMS needs to make coding changes for cardiac procedures which would not punish the doctor for doing the cost-effective treatment. For example, a doctor's fee should not be linked to the cost of the cardiac catheter.
- We build over capacity at the medical school level by encouraging more specialists and increasing the supply of highly trained surgeons, which also means we have to generate demand for services through scope creep, marketing directly to patients, and the ever expansion of facilities to be filled with patients who have the money to pay for the procedures.
- Consumer or patient-driven health care is not the same as market driven medicine because patients are not commodities, hospitals are not factories, and money should not be the driving force of health care decisions. Education of patients is the key to providing the right care for each patient, with a much stronger emphasis on prevention. We need to collaborate more effectively so that patients can make informed decisions. Health outcomes need to be patient based, not based on Relative Value Units. We need to figure out the health treatments with the most impact and CMS needs to reward those. Patients need to be informed and accountable.
- Nonoperative treatment needs to be valued more by CMS and insurance companies, because the Journal of Patient Safety cites 440,000 patients are still harmed in U.S. hospitals annually. If doctors are paid for providing preventive care they will do more of it. But as it stands right now, primary care clinicians make the least amount of money in the medical field. More procedures does not necessarily mean more health.
Rhode Island has sparked a unique health effort to meet community needs in under-served areas by creating community centers which incorporate fitness centers, achieve critical mass in community enrollment through representation of community members, provide urgent care services at the center, offer home health visits, and deploy school-based health programs. They plan to fund it through taxation of health services. University of Minnesota professor, Bill Doherty has co-authored the Citizen Health Care Initiative, which aims to engage communities, families, and individual patients to participate and generate health improvements. This community model attempts to instill healthier perspectives and behaviors instead of waiting for major medical interventions at the hospital. Washington State has Healthier Washington, a grant funded project, which is exploring everything from reimbursement and design changes to the state Medicaid plan, to community assessment, and resourcing of health care needs.The real question is whether any of these ambitious programs will be able to improve health. My money is on the Rhode Island community center model.
Have I met all of my health goals since I returned from the conference-no, but I am making progress and just remember Winston Churchill's quote, "You can always count on Americans to do the right thing, after they have tried everything else." And this is the healthpolicymaven signing off encouraging you to think about your health and ask questions before you pursue health treatments.
This article was written by Roberta E. Winter, MHA, MPA, an independent health care analyst and writer and may be shared with others. It is not meant to give medical advice, but to highlight what the experts and the medical evidence show for common surgical procedures which are over utilized in the United States. The article is not a comprehensive review of unnecessary surgeries, especially in cardiac care, because it was written for the layperson.
CO2 Level Hits Record High
The Scripps Institute of Oceanography at UC San Diego takes daily measurements of the atmospheric CO2 levels on Maua Loa, HI. This is the oldest continuous measurement of atmospheric CO2 and is known as the Keeling Curve after the Charles David Keeling who started the measurements back in the 1950s. On March 15, it measured the CO2 level to be 403.10 parts per million (ppm). This is the highest level ever recorded at Mauna Loa. But, don't worry too much, this record will be broken many times this year.
Sunday, March 15, 2015
Guest Submission: Making A Scam Work
A Guest submission for Dialogues on Global Warming
RE: Making a scam work;
Considering the clever subterfuge being employed by man-made climate change deniers we need to consider the supposed legitimacy of those who deny man's culpability. And since we are apparently having more and more, intense, and extreme weather around the world, it is particularly interesting that Global Warming deniers have been ramping up their game in an effort to deny any significant dangers caused by the vast release of Co2 into our worldwide environment.
One article about a “peer-reviewed” study that was published in the 2-14-13 issue of Forbes claimed that a peer reviewed, (survey) determined that a majority of scientists remain skeptical about the proposition that global warming posses a huge threat to mankind, and, also that, valid research about this threat, fails to affirm a need for urgency regarding climate change. But interestingly, the study was done by the APEGA, or the Association of Professional Engineering and Geoscientists ofAlberta, and wouldn't you know—the professionals in that survey were heavily representative of Geologists, which are the least likely scientists to affirm the dangers of man's role in climate change.
In scientific terms, a survey is really nothing more than a glorified poll lacking real controls and objective methodology. Furthermore a genuine Study, found that 97 percent of actively publishing earth scientists agreed that human activities are changing global temperatures. But apparently, since the study cited in Forbes was authored by Lianne M. Lefsrud at the University of Canada, and, Renate E. Meyer, a professor of economics from The University of economicsin Austria, who also studied at The Copenhagen Businesses School in Denmark, the Forbes study was heavily representative of Geologists working in the oil industry categorized as “economic geologists,” who study geology primarily to examine its role in commercial applications—you guessed it—this last group tends to be the most skeptical of anthropogenic (human-caused) global warming. So how objective is a survey that's conclusion highlights scientists who already doubt man's role in global warming? And how strange that scientists working for the advancement of oil interests in Canada, might be biased—Ya think?
The long study citing their opinions is also full of largely unintelligible ten dollar words, that are confusing to even the most intelligent among us. And the APEGA sponsored study itself, admitted that its methodology represented “a convenience, (non-probability) sample, of self-selected respondents, similar to the general APEGA membership.” Furthermore although the survey was sent to 40,000 members of the APEGA, only 1077 completed surveys were received—just 2.69% of the total!
Here is one paragraph from page nine of that lengthy (30 plus page) “study,” which illustrates the convoluted language and terminology used:
Data analysis“From our research question, we developed theoretically informed coding categories based upon a review of the identity, framing, professional competency, and legitimation literatures to heuristically circumscribe the discursive construction of expertise. As we engaged with the data, these coding categories were further refined and applied using NVivo 8.0 in an iterative manner.”
Wikipedia's Online dictionary defines some of these words including;
1. Heuristically: A heuristic method such as one using a mathematical algorithm that solves a problem more quickly, but is not as certain to arrive at an optimal solution. 2.Discursive: (A) to digress from the main point; rambling. (B) A philosophy using reason and argument rather than intuition. 3.Iterative: Of a procedure that involves repetition of steps to achieve the desired outcome. In computing this may involve a mechanism such as a loop.
So, aside from the fact that conventional climate scientists, as well as all other kinds of scientists have (always) relied on reason and logic more than intuition, and that the words “legitimation,” and, “literatures,” are not really used very commonly—If we included the definitions of all of these questionable terms, including those of the more common words, “circumscribe,” and, “theoretically,” we might end up with a paragraph which reads something like this:
“From our research question, we develop coding based on categorical guesses, reviewing identity, framing, professional competency, (I.E. the ability of professionals to determine results based on accuracy and legitimate knowledge) and (literatures?) which legitimizes such research and then uses mathematical methods to arrive at a quick solution that is not certain to be the best answer. Our methodology which circles around in a rambling digression from the main point in order to establish the self proclaimed expertise used in our survey, is based on facts, not intuition. And, as we engaged with the data, these coding categories were further refined and applied using NVivo 8.0. in a procedure including repetitive steps to achieve the desired outcome by using a computing loop.”
If you ask me this is nothing but a pseudo-intellectual application of jargon to justify studies which are rife with vagueness and which lack real credibility due to institutional bias!
The fact remains that without giving undue credit to (fox guarding the hen house surveys), that commonly advance the special interests of big oil and other Co2 producing companies, 97% of actively publishing climate scientists remain convinced about man's primary role in global warming.
And, getting back to that article about this study in Forbes, posted by “James Taylor,” (a contributor), is it any wonder that Forbes includes a disclaimer written in extremely fine print, stating that: “Opinions expressed by Forbes contributors are their own?”
Peter W. Johnson
Superior, WI
Saturday, March 14, 2015
Texas Water Wars
I live in Mason County, far in the western part of the Llano Uplift of the Edwards Plateau. Austin and San Antonio are two hours away. There are 2000 people in the town of Mason and 4000 in the entire county of about 1000 square miles, about 30 times the size of Manhattan Island. The skies are dark here and city people are astounded when they see the stars for the first time. We are more concerned with hitting deer with our cars than with city crime. It's a 60-year drive to Mason from the big cities.
Yesterday, March 13, I drove out to the Eckert James River Bat Cave, one of the largest bat nurseries in the world, and did some volunteer work. We were so far out in the wilderness it looked like a scene from a movie on Africa, including fording streams. There is no cell phone service out there.
You would think a place this remote would be unconcerned with the events in the cities. Unfortunately, that isn't the case. When you talk about Texas one word always comes up when discussing the future - water. There isn't enough of it and there is a fight about it. As it it turns out, Mason has a very high quality aquifer - the Hickory. This water is superb for agriculture and vineyards are springing up all over the county. We are in the heart of the Texas wine country (a multi-billion dollar industry), but we rely on irrigation. Mason averages about 24 inches of rain a year, but I think 20 of those inches fall in three or four storms.
Now, Austin, two hours away, wants our water. Metropolitan Austin has in excess of 1 million people. Versus our 4000. The odds are not in our favor.
So, why the water wars? Two reasons - climbing population and drought.
Texas is one of the fastest growing states in the union. When I was born in 1957 there were about 4 million people in the state. Today, there are nearly 26 million. The farm we lived on is now a neighborhood of multi-million dollar homes surrounded by a large city. And, it keeps increasing.
More people, more demands for water.
At the same time, we have been experiencing drought for years. Depending on the region and the source of information, the drought has been going for anywhere from 5 to 15 years. I can personally attest to how rivers that used to flow with adequate water are now completely dry - and have been for several years.
On top of this is a cause so many people don't want to acknowledge - climate change. Drought in this region is simply something you learn to deal with. But, they are getting more frequent and more severe because of climate change. I find it interesting how people will get all riled up about the water wars and, at the same time, deny that climate change is making the situation worse. Here is a perfect example of a community not far from where I live:
Yesterday, March 13, I drove out to the Eckert James River Bat Cave, one of the largest bat nurseries in the world, and did some volunteer work. We were so far out in the wilderness it looked like a scene from a movie on Africa, including fording streams. There is no cell phone service out there.
 | |
| Jame River, Mason County, TX |
Now, Austin, two hours away, wants our water. Metropolitan Austin has in excess of 1 million people. Versus our 4000. The odds are not in our favor.
So, why the water wars? Two reasons - climbing population and drought.
Texas is one of the fastest growing states in the union. When I was born in 1957 there were about 4 million people in the state. Today, there are nearly 26 million. The farm we lived on is now a neighborhood of multi-million dollar homes surrounded by a large city. And, it keeps increasing.
More people, more demands for water.
At the same time, we have been experiencing drought for years. Depending on the region and the source of information, the drought has been going for anywhere from 5 to 15 years. I can personally attest to how rivers that used to flow with adequate water are now completely dry - and have been for several years.
On top of this is a cause so many people don't want to acknowledge - climate change. Drought in this region is simply something you learn to deal with. But, they are getting more frequent and more severe because of climate change. I find it interesting how people will get all riled up about the water wars and, at the same time, deny that climate change is making the situation worse. Here is a perfect example of a community not far from where I live:
The Southwestern Water Wars: How Drought Is Producing Tensions in TexasIf you want to solve the problem, you have to first understand what the cause is. It's an uphill fight.
Friday, March 13, 2015
More Evidence California Drought Is Manmade
Researchers at Stanford University published a new paper in the Proceedings of the National Academy of Sciences concluding warming caused by humans is responsible for the conditions responsible the California drought. They put only naturally occurring variations into climate models and were unable to get the exiting conditions. It was only when manmade global warming was included that they were able to get the drought. Manmade emissions have resulted in both periods of warming as well as decreased rainfall. The simultaneous occurrance of these conditions is what is responsible for the condition California is experiencing today. They also found that any future dry period is likely to be accompanied by warm temperatures, meaning this will all likely play out again with greater frequency.
And still, people will insist it is all natural.
Here is an abstract from their paper:
And still, people will insist it is all natural.
Here is an abstract from their paper:
A comparison of historical climate data from California with different climate models has shown the influence of human-driven climate change. Noah Diffenbaugh, Daniel Swain, and Danielle Touma of Stanford University examined the state's records of temperature, rainfall, and drought conditions and evaluated the severity of different periods of warming and drought using the Palmer Hydrological Drought Index and the Palmer Drought Severity Index. They then compared those periods with a range of global climate models. The models that included only naturally occurring variations did not accurately depict California's warm periods, but the models that included anthropogenic warming did. The researchers believe that anthropogenic warming has increased the simultaneous occurrence of periods of both warming and decreased rainfall, which has resulted in an increase in the frequency and severity of droughts across the state.
Thursday, March 12, 2015
Oceans Warming Faster Than Believed
Quantifying underestimates of long-term upper-ocean warming, by Paul J. Durack, Peter J. Gleckler, Felix W. Landerer and Karl E. Taylor and published in Nature Climate Change (DOI: 10.1038/NCLIMATE2389) reports on their research to investigate estimates of the ocean heat content (OHC). While there is a record of measurements for the northern hemisphere, there is a lack of measurements in the south. Historically, the few measurements that were actually made were supplemented by using the northern measurements and interpolating values. Durack, et al. found the data for the southern hemisphere was good since 2004, but the heat content before then was underestimated. This, they concluded, underestimated the actual value of the ocean heat content by about 25%. They stated the amount of heat involved was great:
For our purposes here, what this means is the oceans are more sensitive to global warming than previously thought. It is also more evidence that there has been no warming 'pause,' as is frequently claimed. The amount of heat they cite is exceptional, even spread over 35 years. If we were to take the middle value of their range, that comes out to an average of .13 × 1022J yr−1. In comparison, all power plants in the world combined generate about 1018J yr−1, meaning it would take all of our power plants about 1,000 years to generate the amount of energy being absorbed by the oceans every year. That is significant.These adjustments yield large increases (2.2–7.1 × 10²²J 35 yr−1) to current global upper-ocean heat content change estimates, and have important implications for sea level, the planetary energy budget and climate sensitivity assessments.
Incidentally, this was done using real data, not models.
Here are some nice graphics showing the progression of ocean heating from 1955 - 2011.
Wednesday, March 11, 2015
No Need To Worry About Hydrates
Methane is a much more potent greenhouse gas than CO2 and there are vast amounts of methane (trillions of cubic feet of gas) locked up underground in the form of frozen hydrates. A recurring concern I hear is that climbing temperatures will result in these hydrates melting and releasing some portion of the methane into the atmosphere where it will provide a positive feedback to global warming and make it worse.
I've always been skeptical about this, not because I feel it isn't a threat but because I think that is closing the barn door after the cows have gone. Yes, rising temperatures will melt methane hydrates and cause global warming to be worse, but if we take care of the CO2 problem the methane problem will never materialize.
Now, a government scientist is saying the same thing. Ray Boswell, the technology manager for natural gas technologies at DOE’s National Energy Technology Laboratory said,
“CO2′s going to be your big problem. If it causes a methane problem, that’s like someone burning the rubble of your house after a hurricane already hit.”Yes, methane is being released, but it always has been. It is possible the rate of release in increasing. However, the bottom line is still the same - take care of the CO2 problem and the other problems will take care of themselves.
Tuesday, March 10, 2015
Guest Submission: Fictitious Government Plot
The ways that deniers exploit any minor anomaly by using cherry picked data, is truly insidious, but I think we need to also give some attention to the bizarre scenarios and fictitious stories used to justify a supposed government plot.
Thanks for pointing out that the fact that so many scientists in different countries around the world all support the facts about human caused global warming. A conspiracy that vast would truly require suspending all reason to believe. And the fact that all major scientific organizations around the world concur with what is happening, truly places this issue in true perspective.
Even though, most of the climate projections from the 1970s have been proven to be quite accurate, if the people behind the plot back then were to be proven accurate, we can only assume that dumb luck has smiled on them by actually providing the weather extremes that we are now seeing throughout the world, and since most of the original climate scientists must now be of advanced ages, they bought into an enormous diabolical plot that would probably only benefit their grandchildren on the basis of making incredible lucky guesses. Unless they took a time machine to the post 2000 world, they would have had no way to verify that their supposedly false projections would come true--as many have.
The whole government conspiracy assumes that without government grants, most climate scientists would have no way of making money, but since when is it true that scientific research only examine one particular issue--even if it had long ago been proven that global warming was false, I'll wager that scientists would still have their hands full of various forms of climate research involving other aspects of climate, or would be doing research in entirely different fields. Besides how many times have we seen a research scientist in any walk of life, living a rich and opulent lifestyle? The plot would also, certainly not be a partisan one either, since many Republicans and even several Republican President have been in power since climate change became the subject of much research, so why would the GW Bush's administration for example, not try to work with researchers to change their story. GW is largely responsible for ignoring the Kyoto agreement, and as an oil rich millionaire has no reason to want to place a burden on big oil such as reducing their C02 emissions. Did you hear about any massive numbers of scientists taking Bush's 8 years as a opportunity to declare their freedom and renounce cruel liberal taskmasters--I didn't! But if this falsehood becomes important enough for them to deny, I'm sure that deniers will create some other fantastic spin to justify the existence of such an incredible plot.
What is the most perplexing thing of all, is why average Americans who are not very familiar with scientific knowledge of any kind, are so willing to take the words of laymen and political opportunists who are often employed by conservative think tanks and/or big oil? Everyone knows that if we want our kidney stones removed we should consult an accredited surgeon, but deniers have successfully circulated the idea that somehow those employed by big oil and those funded by organizations which benefit from denial, are more qualified to edify us, even if they have far more motives and special interest backing to justify their lies than any typical research scientist. The day this myth is shattered and really hits home, we may be on the way to a world in which average people are aware of the truth--hopefully sooner than later!
Send Inhofe a Snowball!
The organization Environmental action will be hand delivering a snowball to Senator Inhofe for every person that signs their pledge. I signed and I invite you to, also. Sign here, if you're interested.
Monday, March 9, 2015
Proving the Negative
One of the most common complaints deniers made about my global warming skeptic challenge was "you cannot prove a negative" as an excuse for why they were unable to prove manmade global warming wasn't real. This, I told them, was a false statement. In fact, all experiments are designed to prove the negative. It's called the null hypothesis. The most common example I gave of proving the negative consisted of my saying the door is locked. If you were to try the door and find it is unlocked, you have proven the negative. I could come up with countless other examples (the Sun is in the backyard, cats are actually dogs, there is a gold coin under a given rock, deniers accept science, etc.), but that one works.
I was reminded of this when I saw an article from the National Science Foundation: Techniques to prove or disprove existence of other planets. Surely, that is just a title. They don't really mean they are proving a negative. Do they?
To the dismay of deniers everywhere - yes, they do mean that. The article is about how habitable planets had been identified around a particular star, Gliese 581, but new technology and methods proved the planets did not exist - "it was disappointing to disprove the habitable zone planets in the Gliese 581 system."
So, if you ever have someone say to you, "You can't prove a negative," be sure to tell them they are wrong and you can prove it. Isn't that actually proving a negative in itself?
Sunday, March 8, 2015
Temperature Record This Winter
I was on a field trip yesterday to the Gault Site, one of the most important archeological sites in the Americas. It was a great trip and our host was extremely knowledgeable and enthusiastic about the work done there. I learned a lot during the five hour tour. Then, we topped it off with dinner and wine at the The Vineyard at Florence. They had good food and even better wine. All in all, it was a really nice day, even if the weather was on the chilly side. But, there was one incident I took exception to.
The archeologist giving us the tour brought up the subject of climate change and dismissed the idea of manmade climate change by stating the 'climate always changes.' Normally, I let statements like this go by without comment. People have the right to reject the science, if that is what they want to do, and I am not on some campaign to challenge everyone on their opinions. However, this was a man of science and it was irresponsible for him to make a statement like that. Not only was his statement a false argument, but by using his venue as a recognized expert in his field of study, he was lending credibility to something he was not knowledgeable about. So, I took him to task about it.
When I pointed out how erroneous his statement was and how the science of AGW was absolutely conclusive, someone made the comment, "Tell that to the people in Boston." Well, I have and I do. In fact, the severe winter they are having in the northeast is due to global warming and it is pretty easy to prove it. We know the cold air comes from the Arctic region. So, tell me, where does the energy needed to move that mass of air come from? When you answer that question, you have all the proof any reasonable person needs.
The other significant point about Boston is that we are not discussing Boston warming, we're discussing global warming. So, how is the rest of the world doing while Boston is digging out of all of that snow?
According to the National Climatic Data Center, there have been 15,000 record highs so far this winter (2014-2015). Yes, you read that correctly - 15,000 record high temperatures. At the same time, there have been 10,000 record lows. In fact, no state had an average temperature in the bottom ten lowest on record. Let that sink in. Despite all of the talk about the amount of snow and the bone-chilling cold, not even a single state had a top ten record cold winter. Not one.
Even I was a bit surprised by this. I have been following the cold air masses closely and they have been cold and frequent. I thought, surely, some of the states were seeing a significantly cold winter. But, no. The reason is pretty simple, it has gotten so warm and winters have become so mild they seem to be so much worse than they really are - at least when you compare them to the way winters used to be. When you consider the cold winters the Eastern U.S. used to have, this current winter turns out to be not so bad.
So, to answer the gentleman's objection from yesterday, I really will tell the people in Boston man made global warming is real.
Friday, March 6, 2015
Arctic Sea Ice Not Doing Well
There has been a lot of news about the Arctic sea ice going around lately. None of it has been good. But, by now, that isn't a surprise. For those who haven't been keeping track, the tally on climate change news has been overwhelmingly in favor of the bad news variety.
A new study has come out that used an extensive amount of data from multiple sources. They used data collected by under-ice submarines, IceBridge plane flights, satellite data and even onsite measurements made by hand. Their research led to the conclusion the thickness of sea ice has decreased by 65% between 1975 and 2012. The specific number for September, when the ice is at its least extent, is even worse. They found the September thickness had decreased by 85% over that same time period. Not only has the extent decreased by 40% since 1980, but what is left is also 65% thinner. This means we can expect to see the rate of sea ice extent loss accelerate in the years to come. We can't be sure of the exact time table on that loss, but we can be sure it is coming.
With that in mind, I have to wonder what the data are telling us about the state of the ice right now. It appears there may be a serious problem with the ice extent.
This is a plot of the ice extent as reported by the National Snow and Ice Data Center (NSIDC):
The dark, solid line is the 1981 - 2010 average ice extent for the year. The dark, dashed line is the ice extent for 2012, the year with the record low minimum extent, which occurs in September. The purplish colored line is the extent for 2006, the year with the lowest maximum extent, which occurs in March. The blue line is the extent for this year. If you look closely, you can see the extent has been very close to a record low for the entire winter and now has turned lower. Instead of increasing extent, we are seeing decreasing extent. There are still about two weeks of ice growth season remaining, but this reduction in ice cannot be good. If we have actually passed maximum extent for the year, this would represent the smallest maximum extent ever recorded. And now, we find out it is also 65% thinner that it used to be.
In fact, the data indicate we may have already passed maximum ice extent for this year. Take a look at the ice temperature data from the Polar Portal:
I am not a fan of their selection for color distribution because it makes it difficult to judge the temperature accurately, but we can see the edge of the ice is already at, or above, the freezing point for water. That color extends well into the interior of the ice covered area. In other words, the ice is melting, not forming.
Take a look at one more graphic:
The light blue line indicates the average ice extent for this date. You can easily see just how much water area used to have ice this time of year and no longer does. In particular, look at the Gulf of Bothnia between Sweden and Finland. The blue line indicates it used to be completely frozen over. And, we're not talking about centuries ago. This is the 1979 - 2000 average. A mere three decades ago people were able to walk across that gulf, but not any more.
This data all leads me to believe we have already witnessed the sea ice maximum extent for this year. Like I said, there are still a couple of weeks to go in the season so I might be wrong. Hopefully, I am. Because if I'm right, the sea ice extent is not only much smaller this year, but it is also much thinner and we might be facing a bad melt season.
Stay tuned.
A new study has come out that used an extensive amount of data from multiple sources. They used data collected by under-ice submarines, IceBridge plane flights, satellite data and even onsite measurements made by hand. Their research led to the conclusion the thickness of sea ice has decreased by 65% between 1975 and 2012. The specific number for September, when the ice is at its least extent, is even worse. They found the September thickness had decreased by 85% over that same time period. Not only has the extent decreased by 40% since 1980, but what is left is also 65% thinner. This means we can expect to see the rate of sea ice extent loss accelerate in the years to come. We can't be sure of the exact time table on that loss, but we can be sure it is coming.
With that in mind, I have to wonder what the data are telling us about the state of the ice right now. It appears there may be a serious problem with the ice extent.
This is a plot of the ice extent as reported by the National Snow and Ice Data Center (NSIDC):
 |
| Source: NSIDC |
The dark, solid line is the 1981 - 2010 average ice extent for the year. The dark, dashed line is the ice extent for 2012, the year with the record low minimum extent, which occurs in September. The purplish colored line is the extent for 2006, the year with the lowest maximum extent, which occurs in March. The blue line is the extent for this year. If you look closely, you can see the extent has been very close to a record low for the entire winter and now has turned lower. Instead of increasing extent, we are seeing decreasing extent. There are still about two weeks of ice growth season remaining, but this reduction in ice cannot be good. If we have actually passed maximum extent for the year, this would represent the smallest maximum extent ever recorded. And now, we find out it is also 65% thinner that it used to be.
In fact, the data indicate we may have already passed maximum ice extent for this year. Take a look at the ice temperature data from the Polar Portal:
 |
| Source: Polar Portal |
Take a look at one more graphic:
 | |||||
| Source: Climate Reanalyzer |
This data all leads me to believe we have already witnessed the sea ice maximum extent for this year. Like I said, there are still a couple of weeks to go in the season so I might be wrong. Hopefully, I am. Because if I'm right, the sea ice extent is not only much smaller this year, but it is also much thinner and we might be facing a bad melt season.
Stay tuned.
Thursday, March 5, 2015
Weak El Nino Conditions Exist
The National Weather Service has announced weak El Nino conditions now exist and there is a 50-60% chance it will continue through the Northern Hemisphere summer of 2015.
I have been following the El Nino - Southern Oscillation (ENSO) conditions closely since last spring when it began to look as though the ENSO conditions might come to pass. There are some areas in the equatorial Pacific that are monitored closely - Area 1+2 - located near South America; Area 3- located a little further out; Area 4- located even further west; and Area 3.4, which overlaps areas 3 and 4. It is 3.4, essentially in the middle of the Pacific Ocean, they pay most attention to and is specifically mentioned in the NWS announcement.
At least twice in the last year I thought the ENSO had begun, once in the late spring and once in the fall. In addition to the borderline conditions there were also weak weather patterns consistent with it occurring. Each of those times the conditions came apart, though. My guess is the mechanisms responsible for causing this event (and it is very complicated) were getting close to coming together, but not quite.
So, what does this mean for worldwide weather and the climate? My guess right now (a fool's errand) is that it won't have a very large impact. It looks as though it is a weak system and any impact will be small.
Significantly, it is not likely this system will do much for the California drought. Instead, the data indicate the snowpack in the Sierra Nevada mountains is dangerously low, meaning California will have another terrible summer. Statewide, the snowpack is measured at just 19 percent of the long term average. A weak El Nino will not change that.
According to the NWS, some areas of the planet may see some light affects from this El Nino, but worldwide effects are not expected. How all of this ties together is something for scientists to study and figure out. While I follow it, I am not involved in any kind of research on ENSO so I can't state what this on-again/off-again cycle means. Hopefully, though, it is one more piece of the puzzle to help us figure out this very important system in our climate.
Tuesday, March 3, 2015
Now We Know Why There Are No Dinosaurs
Putting a little humor into a serious topic. Now, that's a skill.
https://www.youtube.com/watch?v=4EZMkNSWdxo
https://www.youtube.com/watch?v=4EZMkNSWdxo
Climate Change and the California Drought
There has been a great deal of debate about the topic of what is causing the massive drought in California. Has manmade climate change caused the drought, made it worse or had no effect on something that would have happened anyway? This question is compounded by climate scientists that have taken the tack of saying you can't tell for certain if climate change has caused a particular event or not. To this last I say, 'Bunk!'
These are the facts:
So, the question about the California drought and climate change is no longer about if it was made worse, or even caused, by AGW. It was. And, we all have to pay the more than $2 billion in damages it is causing. That comes out to about another $7 per year for every person in the country. Add that to the hundreds, or thousands, of dollars you are already spending because of climate change. The question has become what, and when, are we going to have what it takes to do something about it.
Oh, did I mention the Koch brothers are laughing their asses off at you?
Well, now a new study confirms what I've been saying. Sorry - they didn't confirm the Koch brothers no longer have asses. But, they did confirm the California drought is due to manmade emissions.
Basically, what they found is a drought doesn't just happen in a period of low precipitation. It is more likely to occur when there is also elevated temperatures. Well, with global warming, every year has elevated temperatures, meaning any period with reduced precipitation is at risk of leading to a drought.
I find it particularly interesting to note their statistics. According to their research, there have been six drought in the last 20 years and 14 droughts in the 98 years before that. That comes out to .3 droughts per year over the last 20 years and .14 droughts per year for the 98 years before that. That means California droughts are twice as likely today as they were previously.
At what point do people stop looking at the statistics like this and say, 'Yes, I understand the climate is seriously changing right now.'
At what point do people stop denying the science and say, 'Yes, the billionaires are the only ones benefiting from this?'
These are the facts:
- The climate has more energy now than it has at any time in at least 800,000 years. This is indisputable. (Please, if you want to deny the science go away right now.)
- Weather is dependent on energy in the atmosphere. No energy, no weather.
- The more energy there is, the more energetic weather will be.
So, the question about the California drought and climate change is no longer about if it was made worse, or even caused, by AGW. It was. And, we all have to pay the more than $2 billion in damages it is causing. That comes out to about another $7 per year for every person in the country. Add that to the hundreds, or thousands, of dollars you are already spending because of climate change. The question has become what, and when, are we going to have what it takes to do something about it.
Oh, did I mention the Koch brothers are laughing their asses off at you?
Well, now a new study confirms what I've been saying. Sorry - they didn't confirm the Koch brothers no longer have asses. But, they did confirm the California drought is due to manmade emissions.
Basically, what they found is a drought doesn't just happen in a period of low precipitation. It is more likely to occur when there is also elevated temperatures. Well, with global warming, every year has elevated temperatures, meaning any period with reduced precipitation is at risk of leading to a drought.
I find it particularly interesting to note their statistics. According to their research, there have been six drought in the last 20 years and 14 droughts in the 98 years before that. That comes out to .3 droughts per year over the last 20 years and .14 droughts per year for the 98 years before that. That means California droughts are twice as likely today as they were previously.
At what point do people stop looking at the statistics like this and say, 'Yes, I understand the climate is seriously changing right now.'
At what point do people stop denying the science and say, 'Yes, the billionaires are the only ones benefiting from this?'
Monday, March 2, 2015
Another Reason to Care About Climate Change - ISIS
A new study was released today in the Proceedings of the National Academy of Sciences describing how the drought in Syria has been, at the least, made worse by climate change. The drought lasted from 2007 until 2010 and was the worst ever recorded in Syria (strange how we keep seeing the 'worst ever' or the third 500-year event in the last five years). Because of this drought, approximately 1.5 million people moved from rural areas into the cities. The influx of climate refugees into the cities caused civil unrest and was a factor in the beginning of the Syrian civil war. That civil war continues today and was a major factor in the rise of ISIS. Climate change was not the only factor involved, but it contributed to making the drought worse, leading to subsequent events.
This is very consistent what the Department of Defense has said about climate change. It is also consistent with previous studies that found climate change is adding to regional armed conflicts.
I know the deniers will debate this and that is unfortunate. While we are debating, the issue will continue to get even worse. The data is in and things are playing out just as predicted.
And, the evidence continues to mount that climate change is not doing us more good than harm
Subscribe to:
Posts (Atom)