Melt extent in Greenland was well above average in 2014, tying for the 7th highest extent in the 35-year satellite record.The figure below showss the surface melt day anomaly for the last four years, the number of melt days compared to the average number of melt days. You can see the pattern hasn't been good. The number of melt days is increasing for the low-altitudes regions.
 |
| Source: NSIDC |
We'll say 2012 was an abnormality and discount that one. Let's hope we don't see any more years like that one. That still leaves a clear pattern of an increased number of melt days these last few years compared to the long-term average number of melt days.Comparing the seasonal progression of the four most recent years, the recent tendency for greater-than-average melt extent is apparent, as are the rapid variations in melt extent mid-year.
In case you are plan on objecting on the basis the interior is experiencing a normal melt routine, consider these facts:
- As the ice melts the higher altitudes get lower every year, increasing the number of melt days;
- As the coastal ice melts, the interior ice will push out and spread, again bringing the higher altitude ice down;
- As the melt season increases it results in dark pools of water sitting on the surface for longer periods of time where they absorb more sunlight than the reflective ice, increasing the amount of melting.
In the paper, The pattern of anthropogenic signal emergence in Greenland Ice Sheet surface mass balance, published in Geophysical Research Letters last August, researchers concluded human-driven climate change is increasingly responsible for current trends in Greenland Ice Sheet melt and accumulation. They also concluded human activity will dominate further melt and accumulation pattern throughout the 21st century.
In case you still think the Greenland Ice Sheet is recovering, take a look at this graph:
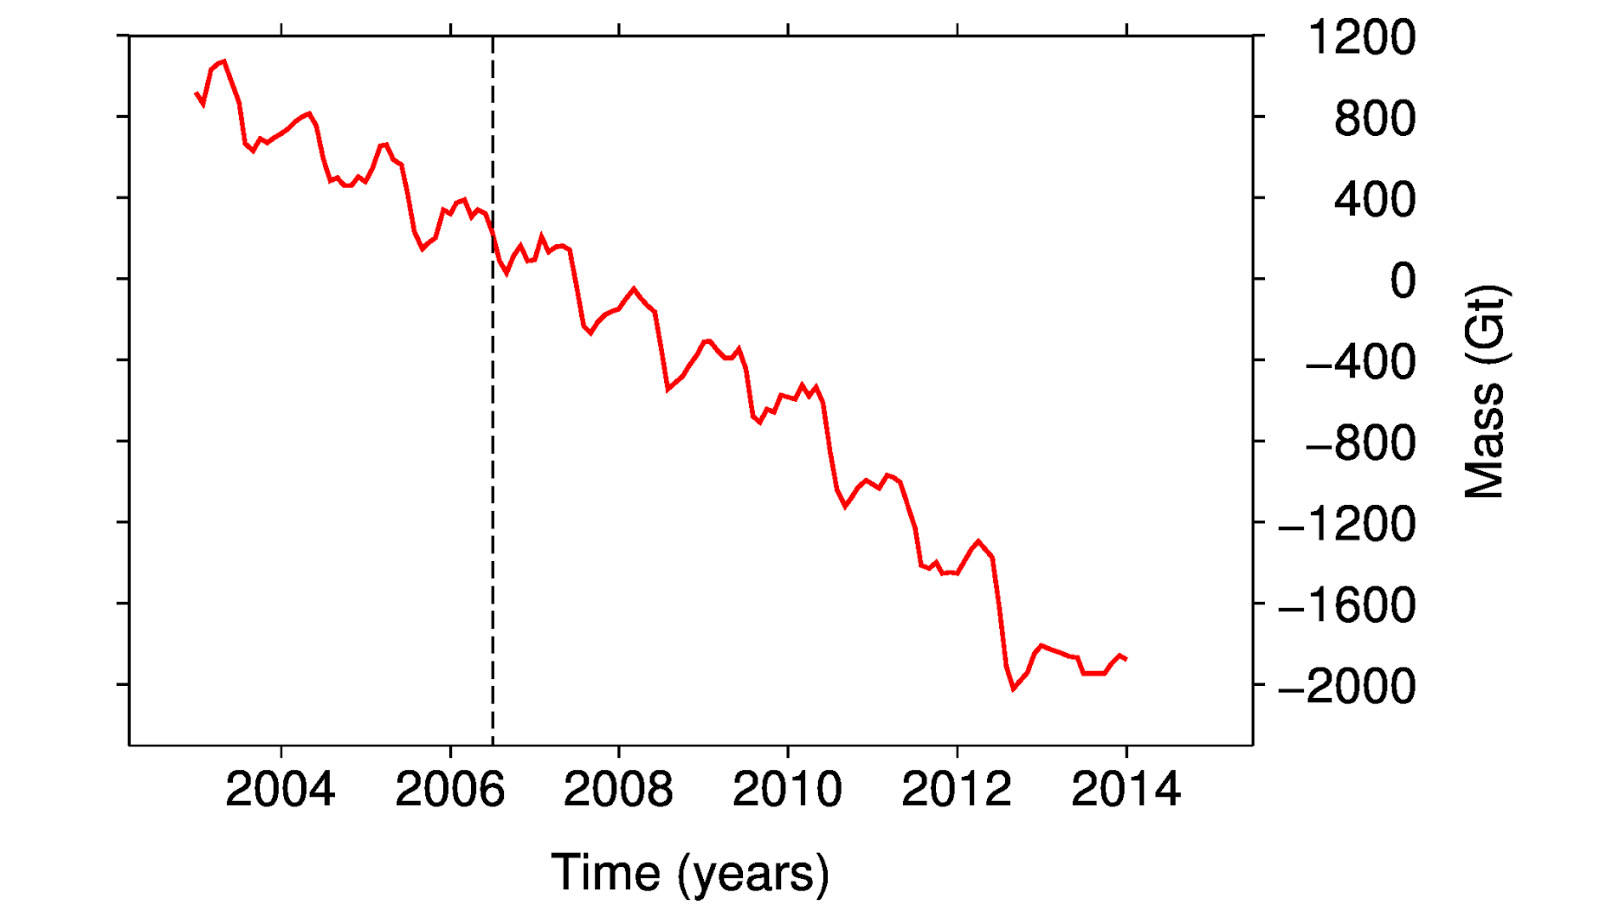 |
| Source: Polar Portal |
By the way, the NSIDC report also said the top eight melt extent years have all occurred since 2002.
No comments:
Post a Comment