Dear Mr. Keeting:
I accept your challenge.
Under the rules of the Scientific Method, if the empirical evidence doesn't match hypothetical projections, the hypothesis can be deemed disconfirmed.
RESPONSE: This is a fatal misunderstanding of the scientific method. Bad start. Review this submission here for one example of someone that has already made this claim. Essentially, climate change is not a single theory. It is a umbrella term that covers at least hundreds, maybe thousands, of different theories coming together. Each of these theories is independently tested and verified. If you wish to prove AGW is not valid this way, you would have to independently invalidate each of those theories.
1) CAGW's global temp projections/Water Vapor
CAGW "best guess" Equilibrium Climate Sensitivity (ECS) is 3.0C~4.5C by 2100. This projection was calculated by CO2's forcing effect 5.35 x ln(560ppm/280ppm)= 3.7 watts, which, using the Stefan-Boltzman constant, will generate NET global warming of 1.2C by 2100.
The CAGW hypothesis then projects that 1.2C of GROSS CO2 induced warming will generate a "runaway feedback loop" involving ever increasing atmospheric water vapor concentrations, which will multiply this GROSS 1.2C of GROSS potential CO2 warming by a factor of 3 to 4 TIMES, which yields CAGW's NET best guess estimate of 3.0C~4.5C by 2100.
Atmospheric water vapor concentrations are NOT rapidly increasing as the CAGW hypothesis projected as can be seen by NOAA's relative humidity data, NOAA's specific humidity data and NASA's Water Vapor Project (NVAP):
 http://nvap.stcnet.com
From the above empirical data there is absolutely no signal showing an exponential growth of water vapor concentrations.
RESPONSE: I'm not sure what your point is here. As the temperature goes up, the air can hold more water vapor. As a result, the relative humidity will remain about the same even as the total amount of water vapor in the air increases. Yes, the total amount of water vapor has been increasing.
2) 30-yr PDO cycles and Global warming correlation
There is some sinusoidal variation of water vapor concentrations, but this is better correlated to 30-yr PDO warm/cool cycles than to the steady rise in CO2 levels. During 30-yr PDO warm cycles, global temps rise and water vapor concentrations rise due to increased ocean evaporation and during 30-yr PDO cool cycles, water vapor concentrations tend to fall due to slightly reduced ocean evaporation:
http://www.woodfortrees.org/pl...
You will also notice from the above PDO cycle graph that there is 100.00% correlation between the 30-yr PDO cycles and global temp trends, i.e when the PDO is in a 30-yr warm cycle, global temps rise, and during 30-yr PDO cool cycles, global temp trends fall.
BTW, a 30-yr PDO cool cycle started in 2005 and look what's happened to global temp trends (the last purple segment of the above graph) i.e. falling global temp trends as has happened during every 30-yr PDO cool cycle since 1850.... CAGW is screwed.
During a typical 30-yr PDO cool cycle, global temps fall at around -0.05C/decade, which means that by 2035, RSS global temp anomaly will be around 0.00C, and CAGW projections for 2035 will be around +1.2C...
RESPONSE: This is a well-debunked claim. There is a nice correlation between the PDO and the climate, but not 100% and only before modern times. In fact, this correlation is good proof that the current warming is not due to the PDO because that correlation has been busted in recent decades. You stated it yourself, the PDO went negative in 2005 and look what has happened to global temps. The SST has continued to rise. The 1980s were the hottest decade ever recorded. Every year of the 1990s was hotter than that average, making the 1990s the hottest decade every recorded. Every year of the 2000s was hotter than that average, making the 2000s the hottest decade ever recorded. Every year of the 2010s has been hotter than than that average, making the 2010s the hottest decade every recorded. 2014 is already the hottest year ever measured and it isn't even over yet. For more, read this article here. So, the PDO turned negative, but the planet has continued to get increasingly warmer. Your premise is shown to be false. The fatal flaw in your logic here is supposing AGW means there are no more natural cycles, therefore, the presence of natural cycles proves AGW is not real. The existence of manmade changes to the climate in now way means natural cycles have stopped. The presence of natural cycles in no way demonstrates manmade climate change is not real.
From 2035~2100, in order for the CAGW hypothesis to be confirmed, CO2 forcing would have to generate 0.72C/decade of warming for the remaining 65 straight years to 2100, which is impossible.
Just from today, this is what global trends would have to be starting from TOMORROW to meet CAGW's upper-end "best guess" estimate of 4.5C of CO2 induced warming by 2100:
 That is impossible as it already requires a trend of 0.50C/decade starting from tomorrow to reach 4.5C by 2100. The temperature trend from July 1996~ October 2014 has been -0.002C/decade for RSS.
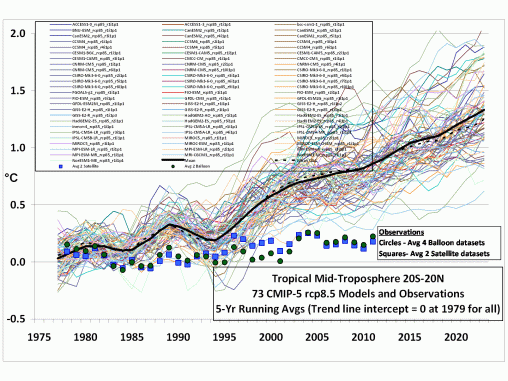
3) CAGW model projections vs. reality
There hasn't been a global warming trend for 18 years and 4 months (RSS data). Accordingly, 73 out of 73 CAGW CMIP5 model projections are now ALL above CAGW projections, which is a 100.00% failure rate:
 As explained earlier, it only gets worse from here because of the PDO cool cycle we're in now.
This complete model failure is already sufficient to disconfirm the CAGW hypothesis as NO model projected flat global temp trends exceeding 15 years. It has already been 18 years and 3 months... Reality already is outside the 95% confidence intervals of the CAGW model projections, which is sufficient for the CAGW hypothesis to be disconfirmed.
RESPONSE: I was expecting you to pull out something from Roy Spencer and you did not fail. This graph above has been shown to be fraudulent and purposefully doctored to provide false results. In fact, your entire argument about models is fatally flawed and very typical. Read my comments here.
4) Polar Ice Extents
The CAGW hypothesis projected that rising CO2 levels would cause BOTH polar ice extents to shrink. This has NOT happened. The Arctic Ice Extent did start to shrink since 1994 when the 30-yr AMO warm cycle started, but since the AMO peaked in 2007, the Arctic Ice Extent has slowly stared to recover. The 2012 Arctic Ice Extent record was an outlier caused by one of the longest and strongest Arctic cyclones in 50 years that occurred in August 2012. Prior to the August 2012 cyclone, Arctic Ice Extents were 2 million KM^2 larger than 2007 levels. Moreover, 2013 was the largest year-on-year Arctic Ice Extent recovery ever recorded, which shows that 2012 was an outlier year:
 Antarctic Ice Extents have actually GROWN over the past 35 years, even though all CAGW models predicted it should have been shrinking... As a matter of fact, earlier this year, the Antarctic shattered the 35-yr Antarctic Ice Extent record:
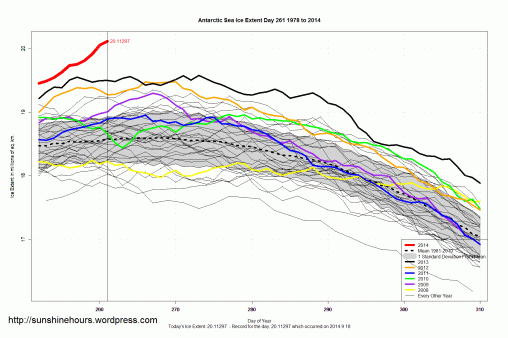 This is just another example of the CAGW models being useless and unskillful, which means the CAGW hypothesis is useless and unskillful and doesn't reflect reality.
RESPONSE: Claims about the ice extent are false for both poles. The Arctic sea ice extent is most definitely not recovering. The sea ice extent increased in 2013, but that was relative to an incredibly bad year of ice extent in 2012. The level in 2014 was lower. The trend in the ice extent is clear. As for the ice extent in Antarctica, the continent is losing massive amounts of ice every year. This melted fresh water is diluting the sea water around the continent, lowering the freezing point. The projections of ice melting at both poles is actually turning out to be lower than the reality. You also forgot to mention Greenland. This claim has been made many times and is still false, no matter how many times someone makes it.
5) Sea Level Rise
The CAGW hypothesis projected a rapid rise in sea levels, but this is not happening. According to the peer-reviewed paper Jevrejeva et al 2014,
The rate of sea level rise in the early 20th century was only 2.03 mm/yr from 1904–1953 and actually fell to 1.45 mm/yr from 1954 to 2003..
So, from 1904 to 1953 , CO2 levels increased by about 15 ppm, and sea levels rose by 2.03 mm/yr, while from 1953 to 2003 , CO2levels increased by around 75 ppm, and sea level rose by 1.45 mm/yr. There is no correlation to sea level rise to CO2 level rise....
Accordingly, we can conclude that sea level rise has actually decelerated by 40% during the same span of years that CO2 levels were increasing by 500% (15 ppm to 75 ppm), an inverse correlation.
This establishes a strong lack of correlation between CO2 forcing and sea level rise acceleration.
This is further enforced by the new paper Jevrejeva et al 2014, which shows a mere 7 INCHES of SLR over the past 200 years...
As an excuse to explain away the total lack of a statistically significant global warming trend for the past 15~18 years (depending on temp database used), CAGW advocates suggest that the "missing heat" was buried in the oceans. However, during the past 10 years, sea level rise has actually FALLEN 30% (Cazenave et al 2014), which should NOT be possible given the thermal expansion which should have occurred if all this "missing heat" was buried in the oceans. Again, CAGW is busted.
RESPONSE: Man, you really do VERY poor homework. NOAA is pretty clear about sea level rise.
5) Severe Weather incidence projections vs. reality
The CAGW hypothesis postulated that global severe weather should be increasing in both frequency and severity as CO2 levels rise, however, the empirical evidence does not support this.
Even IPCC's 2013 AR5 report admits that their previous projections of increased severe weather incidence have been incorrect as shown in the following direct quotes from AR5:
“There is medium evidence and high agreement that long-term trends in normalized losses have not been attributed to natural or anthropogenic climate change”
“The statement about the absence of trends in impacts attributable to natural or anthropogenic climate change holds for tropical and extratropical storms and tornados”
“The absence of an attributable climate change signal in losses also holds for flood losses”
“There is limited evidence of changes in extremes associated with other climate variables since the mid-20th century”
“Current datasets indicate no significant observed trends in global tropical cyclone frequency over the past century … No robust trends in annual numbers of tropical storms, hurricanes and major hurricanes counts have been identified over the past 100 years in the North Atlantic basin”
“In summary, there continues to be a lack of evidence and thus low confidence regarding the sign of trend in the magnitude and/or frequency of floods on a global scale”
“In summary, there is low confidence in observed trends in small-scale severe weather phenomena such as hail and thunderstorms because of historical data inhomogeneities and inadequacies in monitoring systems”
“In summary, the current assessment concludes that there is not enough evidence at present to suggest more than low confidence in a global-scale observed trend in drought or dryness (lack of rainfall) since the middle of the 20th century due to lack of direct observations, geographical inconsistencies in the trends, and dependencies of inferred trends on the index choice. Based on updated studies, AR4 conclusions regarding global increasing trends in drought since the 1970s were probably overstated. However, it is likely that the frequency and intensity of drought has increased in the Mediterranean and West Africa and decreased in central North America and north-west Australia since 1950”
“In summary, confidence in large scale changes in the intensity of extreme extratropical cyclones since 1900 is low”
Even the IPCC admits there hasn't been any increasing trends in severe weather, and yet CAGW advocates still insist there are. This is a falsehood.
RESPONSE: Once again, already debunked. Or, here. That's for starters. Do some homework.
6) The 1980~1998 global warming trend is NOT unprecedented.
The CAGW hypothesis claims the short 18-yr global warming trend from 1980~1998 was unprecedented and was primarily due to CO2 forcing. This is false.
The HADCRUT4 1980~1998 warming trend was 0.14C/decade, which is even less than the 1910~1928 warming trend which was 0.17C/decade. The 1910~1928 global warming trend could not have been caused by CO2 forcing because CO2 levels hardly increased at all in the early 20th century. Even the IPCC admits that CO2 levels were only sufficient to cause any significant warming from 1950...
On a longer scale, 1980~2014, the global warming trend is 0.17C/decade compared to 1910~1944 was 0.14C/decade, which is virtually identical. Moreover, there hasn't been a RSS global warming trend since July 1996 and no HADCRUT4 global warming trend since the January 2001 (-0.001C/decade).
I'll grant you that the difference between these two 34-yr trends may be attributable to CO2 forcing, but it's only a difference of 0.03C/decade and no where NEAR the approximate 0.30C/decade trend of CO2 forcing that is required to confirm the CAGW hypothesis.
The CAGW hypothesis proposes that CO2 levels were only high enough to cause warming from 1950. If so, then why were global temps flat from 1950~1980 (-0.003C/decade). Why indeed.
So, I've shown that the CAGW hypothesis was wrong in its projections of: global warming trends, polar ice extents, severe weather incidence/severity and sea level rise.
There is virtually NO direct correlation nor a strong signal showing catastrophic global warming is possible per doubling of CO2. The empirical evidence and physics show that CO2's forcing effect is somewhere between 0.03C~0.12C/decade, with the most likely value around 0.06C/decade, which is NOTHING to worry about. This tiny amount of CO2 forcing is consistent with Lindzen Choi et al, Lewis and Curry et al, Harde et al, Otto et al, among many other peer-reviewed papers.
RESPONSE: Sorry, this amount of heating is such a short period of time is unprecedented, as well as the CO2 levels. They have not been witnessed within at least the last 800,000 years. Using Lindzen as a reference is a mistake. Everything he has ever claimed as been debunked.
You will of course call all of this data "cherry picking" as you've already indicated in previous posts, but we both know you owe me $30,000 and that CAGW is a disconfirmed hypothesis.
CONCLUSION: In summary, you failed to provide even one single bit of valid scientific evidence to prove AGW. Bad show. Sorry, you did nothing to prove global warming is not real.
I accept your challenge.
Under the rules of the Scientific Method, if the empirical evidence doesn't match hypothetical projections, the hypothesis can be deemed disconfirmed.
RESPONSE: This is a fatal misunderstanding of the scientific method. Bad start. Review this submission here for one example of someone that has already made this claim. Essentially, climate change is not a single theory. It is a umbrella term that covers at least hundreds, maybe thousands, of different theories coming together. Each of these theories is independently tested and verified. If you wish to prove AGW is not valid this way, you would have to independently invalidate each of those theories.
1) CAGW's global temp projections/Water Vapor
CAGW "best guess" Equilibrium Climate Sensitivity (ECS) is 3.0C~4.5C by 2100. This projection was calculated by CO2's forcing effect 5.35 x ln(560ppm/280ppm)= 3.7 watts, which, using the Stefan-Boltzman constant, will generate NET global warming of 1.2C by 2100.
The CAGW hypothesis then projects that 1.2C of GROSS CO2 induced warming will generate a "runaway feedback loop" involving ever increasing atmospheric water vapor concentrations, which will multiply this GROSS 1.2C of GROSS potential CO2 warming by a factor of 3 to 4 TIMES, which yields CAGW's NET best guess estimate of 3.0C~4.5C by 2100.
Atmospheric water vapor concentrations are NOT rapidly increasing as the CAGW hypothesis projected as can be seen by NOAA's relative humidity data, NOAA's specific humidity data and NASA's Water Vapor Project (NVAP):
From the above empirical data there is absolutely no signal showing an exponential growth of water vapor concentrations.
RESPONSE: I'm not sure what your point is here. As the temperature goes up, the air can hold more water vapor. As a result, the relative humidity will remain about the same even as the total amount of water vapor in the air increases. Yes, the total amount of water vapor has been increasing.
2) 30-yr PDO cycles and Global warming correlation
There is some sinusoidal variation of water vapor concentrations, but this is better correlated to 30-yr PDO warm/cool cycles than to the steady rise in CO2 levels. During 30-yr PDO warm cycles, global temps rise and water vapor concentrations rise due to increased ocean evaporation and during 30-yr PDO cool cycles, water vapor concentrations tend to fall due to slightly reduced ocean evaporation:
http://www.woodfortrees.org/pl...
You will also notice from the above PDO cycle graph that there is 100.00% correlation between the 30-yr PDO cycles and global temp trends, i.e when the PDO is in a 30-yr warm cycle, global temps rise, and during 30-yr PDO cool cycles, global temp trends fall.
BTW, a 30-yr PDO cool cycle started in 2005 and look what's happened to global temp trends (the last purple segment of the above graph) i.e. falling global temp trends as has happened during every 30-yr PDO cool cycle since 1850.... CAGW is screwed.
During a typical 30-yr PDO cool cycle, global temps fall at around -0.05C/decade, which means that by 2035, RSS global temp anomaly will be around 0.00C, and CAGW projections for 2035 will be around +1.2C...
RESPONSE: This is a well-debunked claim. There is a nice correlation between the PDO and the climate, but not 100% and only before modern times. In fact, this correlation is good proof that the current warming is not due to the PDO because that correlation has been busted in recent decades. You stated it yourself, the PDO went negative in 2005 and look what has happened to global temps. The SST has continued to rise. The 1980s were the hottest decade ever recorded. Every year of the 1990s was hotter than that average, making the 1990s the hottest decade every recorded. Every year of the 2000s was hotter than that average, making the 2000s the hottest decade ever recorded. Every year of the 2010s has been hotter than than that average, making the 2010s the hottest decade every recorded. 2014 is already the hottest year ever measured and it isn't even over yet. For more, read this article here. So, the PDO turned negative, but the planet has continued to get increasingly warmer. Your premise is shown to be false. The fatal flaw in your logic here is supposing AGW means there are no more natural cycles, therefore, the presence of natural cycles proves AGW is not real. The existence of manmade changes to the climate in now way means natural cycles have stopped. The presence of natural cycles in no way demonstrates manmade climate change is not real.
From 2035~2100, in order for the CAGW hypothesis to be confirmed, CO2 forcing would have to generate 0.72C/decade of warming for the remaining 65 straight years to 2100, which is impossible.
Just from today, this is what global trends would have to be starting from TOMORROW to meet CAGW's upper-end "best guess" estimate of 4.5C of CO2 induced warming by 2100:

3) CAGW model projections vs. reality
There hasn't been a global warming trend for 18 years and 4 months (RSS data). Accordingly, 73 out of 73 CAGW CMIP5 model projections are now ALL above CAGW projections, which is a 100.00% failure rate:

This complete model failure is already sufficient to disconfirm the CAGW hypothesis as NO model projected flat global temp trends exceeding 15 years. It has already been 18 years and 3 months... Reality already is outside the 95% confidence intervals of the CAGW model projections, which is sufficient for the CAGW hypothesis to be disconfirmed.
RESPONSE: I was expecting you to pull out something from Roy Spencer and you did not fail. This graph above has been shown to be fraudulent and purposefully doctored to provide false results. In fact, your entire argument about models is fatally flawed and very typical. Read my comments here.
4) Polar Ice Extents
The CAGW hypothesis projected that rising CO2 levels would cause BOTH polar ice extents to shrink. This has NOT happened. The Arctic Ice Extent did start to shrink since 1994 when the 30-yr AMO warm cycle started, but since the AMO peaked in 2007, the Arctic Ice Extent has slowly stared to recover. The 2012 Arctic Ice Extent record was an outlier caused by one of the longest and strongest Arctic cyclones in 50 years that occurred in August 2012. Prior to the August 2012 cyclone, Arctic Ice Extents were 2 million KM^2 larger than 2007 levels. Moreover, 2013 was the largest year-on-year Arctic Ice Extent recovery ever recorded, which shows that 2012 was an outlier year:


RESPONSE: Claims about the ice extent are false for both poles. The Arctic sea ice extent is most definitely not recovering. The sea ice extent increased in 2013, but that was relative to an incredibly bad year of ice extent in 2012. The level in 2014 was lower. The trend in the ice extent is clear. As for the ice extent in Antarctica, the continent is losing massive amounts of ice every year. This melted fresh water is diluting the sea water around the continent, lowering the freezing point. The projections of ice melting at both poles is actually turning out to be lower than the reality. You also forgot to mention Greenland. This claim has been made many times and is still false, no matter how many times someone makes it.
5) Sea Level Rise
The CAGW hypothesis projected a rapid rise in sea levels, but this is not happening. According to the peer-reviewed paper Jevrejeva et al 2014,
The rate of sea level rise in the early 20th century was only 2.03 mm/yr from 1904–1953 and actually fell to 1.45 mm/yr from 1954 to 2003..
So, from 1904 to 1953 , CO2 levels increased by about 15 ppm, and sea levels rose by 2.03 mm/yr, while from 1953 to 2003 , CO2levels increased by around 75 ppm, and sea level rose by 1.45 mm/yr. There is no correlation to sea level rise to CO2 level rise....
Accordingly, we can conclude that sea level rise has actually decelerated by 40% during the same span of years that CO2 levels were increasing by 500% (15 ppm to 75 ppm), an inverse correlation.
This establishes a strong lack of correlation between CO2 forcing and sea level rise acceleration.
This is further enforced by the new paper Jevrejeva et al 2014, which shows a mere 7 INCHES of SLR over the past 200 years...
As an excuse to explain away the total lack of a statistically significant global warming trend for the past 15~18 years (depending on temp database used), CAGW advocates suggest that the "missing heat" was buried in the oceans. However, during the past 10 years, sea level rise has actually FALLEN 30% (Cazenave et al 2014), which should NOT be possible given the thermal expansion which should have occurred if all this "missing heat" was buried in the oceans. Again, CAGW is busted.
RESPONSE: Man, you really do VERY poor homework. NOAA is pretty clear about sea level rise.
5) Severe Weather incidence projections vs. reality
The CAGW hypothesis postulated that global severe weather should be increasing in both frequency and severity as CO2 levels rise, however, the empirical evidence does not support this.
Even IPCC's 2013 AR5 report admits that their previous projections of increased severe weather incidence have been incorrect as shown in the following direct quotes from AR5:
“There is medium evidence and high agreement that long-term trends in normalized losses have not been attributed to natural or anthropogenic climate change”
“The statement about the absence of trends in impacts attributable to natural or anthropogenic climate change holds for tropical and extratropical storms and tornados”
“The absence of an attributable climate change signal in losses also holds for flood losses”
“There is limited evidence of changes in extremes associated with other climate variables since the mid-20th century”
“Current datasets indicate no significant observed trends in global tropical cyclone frequency over the past century … No robust trends in annual numbers of tropical storms, hurricanes and major hurricanes counts have been identified over the past 100 years in the North Atlantic basin”
“In summary, there continues to be a lack of evidence and thus low confidence regarding the sign of trend in the magnitude and/or frequency of floods on a global scale”
“In summary, there is low confidence in observed trends in small-scale severe weather phenomena such as hail and thunderstorms because of historical data inhomogeneities and inadequacies in monitoring systems”
“In summary, the current assessment concludes that there is not enough evidence at present to suggest more than low confidence in a global-scale observed trend in drought or dryness (lack of rainfall) since the middle of the 20th century due to lack of direct observations, geographical inconsistencies in the trends, and dependencies of inferred trends on the index choice. Based on updated studies, AR4 conclusions regarding global increasing trends in drought since the 1970s were probably overstated. However, it is likely that the frequency and intensity of drought has increased in the Mediterranean and West Africa and decreased in central North America and north-west Australia since 1950”
“In summary, confidence in large scale changes in the intensity of extreme extratropical cyclones since 1900 is low”
Even the IPCC admits there hasn't been any increasing trends in severe weather, and yet CAGW advocates still insist there are. This is a falsehood.
RESPONSE: Once again, already debunked. Or, here. That's for starters. Do some homework.
6) The 1980~1998 global warming trend is NOT unprecedented.
The CAGW hypothesis claims the short 18-yr global warming trend from 1980~1998 was unprecedented and was primarily due to CO2 forcing. This is false.
The HADCRUT4 1980~1998 warming trend was 0.14C/decade, which is even less than the 1910~1928 warming trend which was 0.17C/decade. The 1910~1928 global warming trend could not have been caused by CO2 forcing because CO2 levels hardly increased at all in the early 20th century. Even the IPCC admits that CO2 levels were only sufficient to cause any significant warming from 1950...
On a longer scale, 1980~2014, the global warming trend is 0.17C/decade compared to 1910~1944 was 0.14C/decade, which is virtually identical. Moreover, there hasn't been a RSS global warming trend since July 1996 and no HADCRUT4 global warming trend since the January 2001 (-0.001C/decade).
I'll grant you that the difference between these two 34-yr trends may be attributable to CO2 forcing, but it's only a difference of 0.03C/decade and no where NEAR the approximate 0.30C/decade trend of CO2 forcing that is required to confirm the CAGW hypothesis.
The CAGW hypothesis proposes that CO2 levels were only high enough to cause warming from 1950. If so, then why were global temps flat from 1950~1980 (-0.003C/decade). Why indeed.
So, I've shown that the CAGW hypothesis was wrong in its projections of: global warming trends, polar ice extents, severe weather incidence/severity and sea level rise.
There is virtually NO direct correlation nor a strong signal showing catastrophic global warming is possible per doubling of CO2. The empirical evidence and physics show that CO2's forcing effect is somewhere between 0.03C~0.12C/decade, with the most likely value around 0.06C/decade, which is NOTHING to worry about. This tiny amount of CO2 forcing is consistent with Lindzen Choi et al, Lewis and Curry et al, Harde et al, Otto et al, among many other peer-reviewed papers.
RESPONSE: Sorry, this amount of heating is such a short period of time is unprecedented, as well as the CO2 levels. They have not been witnessed within at least the last 800,000 years. Using Lindzen as a reference is a mistake. Everything he has ever claimed as been debunked.
You will of course call all of this data "cherry picking" as you've already indicated in previous posts, but we both know you owe me $30,000 and that CAGW is a disconfirmed hypothesis.
CONCLUSION: In summary, you failed to provide even one single bit of valid scientific evidence to prove AGW. Bad show. Sorry, you did nothing to prove global warming is not real.
No comments:
Post a Comment