MS Mechanical EngineeringJuly 31, 2014 at 1:02 AM
$30,000 Challenge Submission – No Change in Temperature Rate1. Michael Mann’s data shows global warming started in 1800’s (not mid-1900's
2. Phil Jones said the rate is the same (0.16 ± 0.05 oC/decade) for: 1860 to 1880, 1910 to 1940, 1975 to 1988, and 1975 to 2009. Two natural warming periods before post-1950 increases in C02.
3. Total thermal energy of a system can be defined as Q = mcT. Assumes no phase change. Energy inside system is not dependent on the method of heat transfer in (conduction, convection, or radiation).
4. Temperature record from GISS show a cyclical pattern of periods of cooling (1880 to 1916, 1945 to 1963, and 1998 to present) followed by periods of warming (1917 to 1944 and 1964 to 1998).
5. Rate was the same for both pre-1950 and post-1950 period at 0.16 ± 0.05 oC/decade. Any temperature increase due to man-made CO2 emissions is less than the ± 0.05 oC/decade uncertainty and cannot be detected in the global temperature record alone.
6. Heat transfer rate must be the same for both periods using t = q/mc.
- (q(natural 1917) + q(CO2 1917))/mc = 0.16 ± 0.05 oC/decade = (q(natural 1964) + q(CO2 1964))/mc
- q(natural 1917) - q(natural 1964) = q(CO2 1964) - q(CO2 1917)
7. Analogy: 4 buckets of water at different temperatures represent the 4 components above. Mix together into a common container which represents the global temperature record. You can measure the temperature in the combined container, but you cannot determine the input from each bucket based on the single temperature measurement. Mathematically, you cannot solve for 4 variables in 2 equations. Scientific method is based on data which can be measured.
8. "The sum of the natural cycles is that we are in a naturally cooling phase, not a warming one. If it was not for man-made greenhouse gas emissions, the climate would be much cooler than the long-term average." - Christopher Keating
9. No rate difference means there is no increase in heat. If the pre-1950 rate and post-1950 rates are the same AND there Earth is in a cooling mode, the global warming due to man-made CO2 must EXACTLY match the natural cooling.
10. What are the odds that the sum of 4 separate heat calculations cancel each other out and show no net overall change? Pre-1950 CO2 heat cannot be zero because Guy Callendar's 1938 paper is the origin of the Callendar equation describing the relationship between temperature and CO2. Post-1950 natural heat transfer cannot be zero because we know that volcanoes, solar activity, and El Nino affect global temperatures.
11. No rate difference means there is no acceleration in temperature change,
12. Comparing pre-1950 and post-1950 temperature graphs (using GISS data) normalized to the same 0,0 start, we see that the pre-1950 & post-1950 temperatures have similar curves. The first 13 years of both periods are almost identical. This would be expected if both following a natural cycle. Differences after year 13 can be attributed to volcanoes (which reduce temperature) and El Nino (which increase temperature).
13. The pre-1950 period contributed more to overall temperature rise than post-1950 period. Percentage of global temperature change pre-1950 to overall 1917-1998 period (using GISS data)
- (T(1944) - T(1917) * 100)/(T(1998) - T(1917)) = (0.13 - (-0.44) *100)/(0.61-(-0.44) ) = 54% despite a shorter time period (28 years vs 35 years)
14. Global temperature change is not uniform because much of the temperature change occurred within first 17 % of each period.
- pre-1950 (4 of 28 years) = (T(1921) - T(1917) *100)/(T(1944) - T(1917) ) = (-0.20 - (-0.44) *100)/(0.13-(-0.44) ) = 42%
- post-1950 (5 of 35 years) = (T(1969) - T(1964) *100)/(T(1998) - T(1964) ) = (0.06 - (-0.20) *100)/(0.61-(-0.20) ) = 32%
15. Two articles which refute claim that “missing heat” is going to deep oceans. http://www.nature.com/ngeo/journal/v5/n2/full/ngeo1375.html
http://www.pas.rochester.edu/~douglass/papers/KD_InPress_final.pdf
Response:
1. Here is a reconstruction of the surface temperature for the last 1100 years:
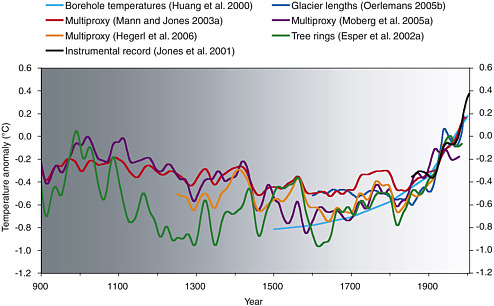 |
| Source: National Academies |
Here is the data for the period starting in the late-1800s:
 |
| Source: NASA GISS |
This data indicates we started coming out of the Little Ice Age sometime in the 1800s. If you wanted to state that, I would not have any problem. But, you indicated some real bias by stating "Michael Mann's data" showed "global warming" started in the mid-1800s. First, Mann is just one of many scientists involved in reconstructing the temperature record. It is a disservice to the thousands of scientists involved in the effort to give Dr. Mann full credit. And, yes, global warming started, or I should say, continued (global warming is real and natural) in the mid-1800s. But, manmade global warming (anthropogenic global warming, which is also real, but not natural) became a large enough effect in the latter part of the 1900s to have a sizable impact on the global climate. The natural global warming continues, but is being added to by the man made effects.
2. Read what Dr. Jones has to say about that here. But, it is irrelevant either way. So, there have been other warming periods. So what? You know how we know this? Because climate scientists did the hard work to discover this data. The point is, what caused the warming periods? The past warming periods can all be attributed to natural cycles and events. Today's warming period cannot. In fact, the naturally occurring events and cycles all lead to the conclusion that this should be a cooling period, not a warming one. The difference is the man made emissions we keep adding to the atmosphere.
3. This is not only fatally simplistic, but it is wrong to begin with. The equation is Q = mc(delta)T, where (delta)T is the change in temperature. And, yes, the way the energy gets into a system is extremely important. If all of the energy from the Sun was coming in as IR radiation it would all be absorbed by the atmosphere and we would be freezing on the surface. As it is, energy from the Sun is not all IR and some is coming in as sunlight which reaches the surface and heats it up. That hot surface then emits IR radiation.
4. Yes, I have said many times, there are naturally occurring cycles. So, what? Where is the evidence that this is a naturally occurring cycle?
5. Read the graph above. Between 1910 and 1940, the average temperature anomaly went from -.35 to +.1, yielding a rate of +.015 degrees C per year. Between 1980 and 2011 the average temperature anomaly went from -.1 to +.51, yielding a rate of .02 degrees C per year. That is an increase of greater than 30% over the earlier rate. And, note that I cherry-picked the "pre-1950" data to give you as big of an advantage as I could. The average between 1920 and 1950 was only about .007 degrees C per year. But, again, what does this have to do with anything? No one is claiming there have been no warming periods in the past. What does any of that have to do with man made global warming?
6. This is a false statement from beginning to end. There is NOTHING in nature that says the heat transfer rate has to be the same for both periods and the temperature average shows that. In fact, your own statements support that. Warming or cooling occurs when there is a difference between the amount of energy coming in versus the amount going out. If more comes in than goes out, warming occurs. If less comes in than goes out, cooling occurs.
7. What does this even mean? You cannot take the global average temperature of previous periods and mix it with the global average temperature of another period. That just does not make sense. This is like taking two football games and averaging your team's scores. If the score in one game was 7-10 against your team and 31-10 for your team in the second game, you can say your team averaged 19 points a game and, therefore, won both games because the other teams averaged only 10 points. A record of 1-1 becomes a record of 2-0. Taking data from 1920-1950 and mixing them with data from 1980-2010 is not a running average.
8. Yes, that is a correct statement, as I have stated in this response.
9. There is nothing in nature that says the warming rate has to exactly match the cooling rate. If the warming rate matched the cooling rate, then the average temperature would remain steady. Warming in the global average means we are warming faster than the cooling cycle is cooling. That is not a tough one.
10. The odds can be very high when you do the physics and math all wrong.
11. That statement, in general, is a correct statement, but is meaningless in this context. Again, your science and math are completely wrong, but in the event we had a situation like this at some point in history all you would be able to demonstrate is that the temperature rate in one period is changing at the same rate as in another period. This would not say anything to the cause and effect of those temperature changes. You could have two periods with the temperature changing at the same rate, yet have the change be caused by two different things.
12. The years immediately following 1950 reflect the natural cycle and man made effects began to first appear in the 1960s and to grow more and more apparent until the late-1970s when their effect began to have a sizable impact on the climate. Volcanoes and El Nino are part of the naturally occurring events and cycles that we spoke of before. Unfortunately, they are not responsible for the warming trend.
13. This is a false argument. You assume the amount of increase for the pre-1950 period plus the amount of increase for the post-1950 period has to be equal to 100%, but that does not include the cooling periods. If we take the greatest increase of the pre-1950 period (again, favoring your claim) we get that it went from an anomaly of -.35 in 1915 to +.1 in 1940. Then, in the post-1950 period, we get that it went from -.1 in 1965 to +.51 in 2011. Using your logic, the pre-1950 period saw an increase of (.1 - (-.35))/(.51 - (-.35)) = 52%. The post-1950 period saw a rise of (.51 - (-.1))/(.51 - (-.35)) = 71%. So, the period before 1950 that saw the greatest amount of warming experienced 52% of the amount of increase that was recorded between 1915 and 2011, while the period after 1950 that saw the greatest amount of warming saw an increase that was equal to 71% of the total amount of warming.
14. Who ever claimed global warming is uniform? And, why is it relevant?
15. OK, someone takes exception to the data. So, what? This does not demonstrate the data is not wrong, it only shoots down the claim by contrarians that there is no debate and that scientists are just all marching along to get government funding. Wow! Thanks for this reference. It will be useful.
In the meantime, they fail to address this data:
 | |
| Source: NOAA |
Clearly, the heat content is continuing to rise. The heat content of the oceans is verified through many resources, including Argo in recent years. Argo is a great system, but has only been deployed since 2000.
In conclusion, you used a bunch of bad physics and erroneous math to make a claim that is irrelevant in any event. So what if the temperature change rate in two different periods do, or don't, match? You failed completely to show there was any connection between the two periods you discussed and you did not show that any kind of connection would show that man made global warming is not real. I at least commend you for putting some effort and using math and science in your submission, even as wrong as it was. That is noticeably better than some of the other submissions that consisted of government conspiracy claims.
You did not prove man made global warming is not real.