Showing posts with label Sea Ice. Show all posts

Wednesday, March 25, 2015

Arctic Sea Ice Minimum Maximum

It has been widely reported the Arctic sea ice extent this year was not only a record low for a maximum extent, but it also came very early. What does this mean? Truthfully, not all that much by itself. After all, some year has to have the minimum maximum and there is a lot fluctuation from one year to the next.

Just what does it mean to say, 'sea ice extent' anyway? The answer to that question reveals why it is so difficult to model the ice extent. The accepted standard for sea ice extent is the area of the ocean that has at least 15% ice cover. Let's do some math and you can see the problem.

Suppose we have, just for example, 1000 square kilometers of 100% ice coverage. If 25% of that ice melts, we now have 1000 square kilometers of 75% ice coverage. Under the 15% rule, they are the same. Now, let's suppose the wind and currents break this up and expands that ice into an area of 1500 square miles. This area will now have an average ice cover of 50%. Under the 15% rule, we have seen an increase in ice extent of 50% even though we have 25% less ice.

The reverse is also true. If we had started with the 1500 square kilometers of 50% coverage, wind and currents could compress this ice into an area of 1000 square kilometers and 75% coverage. This is a reduction in sea ice extent, even though we have the same amount of ice.

The bigger question is, how does this fit in the long-term trend and that is very revealing.

Here is the sea ice trend for March (through 2014), the normal month of maximum extent:

Source: NSIDC
Now we're talking about some issues. Very clearly, the maximum extent that occurs every year is trending down, even with the annual fluctuation. March 2015 will be even lower than the lowest point on this graph, well below the trend line.

Let's compare a few other graphics.

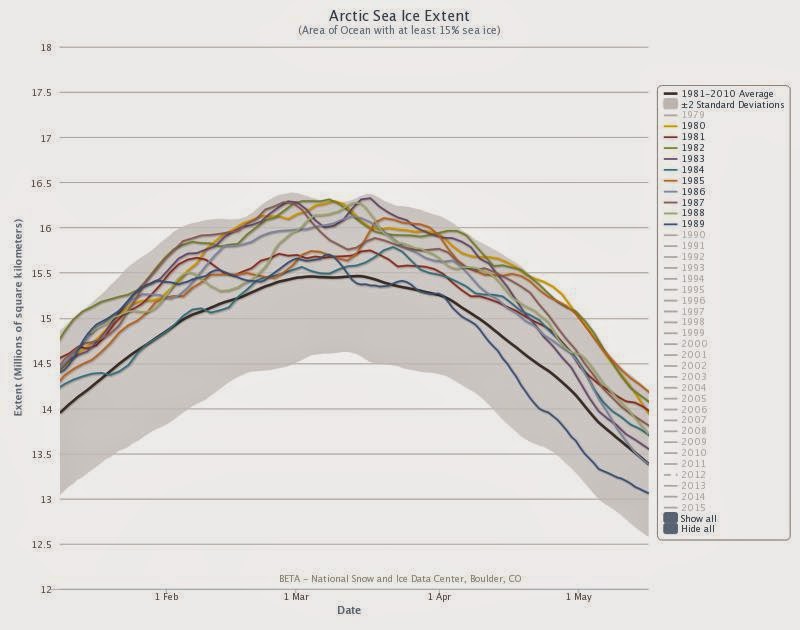
This is a plot of the winter Arctic sea ice extent (including the maximum extent) for the years of 1980 through 1989. The dark solid line in the middle is the 1981 - 2010 average. Almost every year was above the average line for the entire period plotted.:

Source: NSIDC


This is the same plot for the years of 1990 through 1999. Now we see several years plotting below the average line.:

Source: NSIDC


Now, compare to this plot showing the years of 2006 through 2015 (the incomplete line on the bottom). Now, the extent plots below the average for almost all points.:

Source: NSIDC

When you compare these three plots you can see that the extent is decreasing rapidly. Not only that, we can see there were places that routinely had ice cover in 1980 that have not seen ice for decades.


Now, that statement about this being the minimum maximum means something.

And, keep in mind this is what is happening in the dark of the winter. There can be no mistaken belief it is caused by some reduction in sunlight. There is only one possible explanation - the Arctic Region is getting warmer, even in the winter time. Some combination of warmer air and warmer seas is keeping the ice from forming the way it used to.

By the way, in the same vein, I read an article describing how the snow in Wyoming is melting earlier every year and is now melting 16 days earlier than it was in the 1970s.

Coincidence?


Friday, March 6, 2015

Arctic Sea Ice Not Doing Well

There has been a lot of news about the Arctic sea ice going around lately. None of it has been good. But, by now, that isn't a surprise. For those who haven't been keeping track, the tally on climate change news has been overwhelmingly in favor of the bad news variety.

A new study has come out that used an extensive amount of data from multiple sources. They used data collected by under-ice submarines, IceBridge plane flights, satellite data and even onsite measurements made by hand. Their research led to the conclusion the thickness of sea ice has decreased by 65% between 1975 and 2012. The specific number for September, when the ice is at its least extent, is even worse. They found the September thickness had decreased by 85% over that same time period. Not only has the extent decreased by 40% since 1980, but what is left is also 65% thinner. This means we can expect to see the rate of sea ice extent loss accelerate in the years to come. We can't be sure of the exact time table on that loss, but we can be sure it is coming.

With that in mind, I have to wonder what the data are telling us about the state of the ice right now. It appears there may be a serious problem with the ice extent.

This is a plot of the ice extent as reported by the National Snow and Ice Data Center (NSIDC):

Source: NSIDC

The dark, solid line is the 1981 - 2010 average ice extent for the year. The dark, dashed line is the ice extent for 2012, the year with the record low minimum extent, which occurs in September. The purplish colored line is the extent for 2006, the year with the lowest maximum extent, which occurs in March.  The blue line is the extent for this year. If you look closely, you can see the extent has been very close to a record low for the entire winter and now has turned lower. Instead of increasing extent, we are seeing decreasing extent. There are still about two weeks of ice growth season remaining, but this reduction in ice cannot be good. If we have actually passed maximum extent for the year, this would represent the smallest maximum extent ever recorded. And now, we find out it is also 65% thinner that it used to be.

In fact, the data indicate we may have already passed maximum ice extent for this year. Take a look at the ice temperature data from the Polar Portal:

Source: Polar Portal
I am not a fan of their selection for color distribution because it makes it difficult to judge the temperature accurately, but we can see the edge of the ice is already at, or above, the freezing point for water. That color extends well into the interior of the ice covered area. In other words, the ice is melting, not forming.

Take a look at one more graphic:

Forecast Image
Source: Climate Reanalyzer


The light blue line indicates the average ice extent for this date. You can easily see just how much water area used to have ice this time of year and no longer does. In particular, look at the Gulf of Bothnia between Sweden and Finland. The blue line indicates it used to be completely frozen over. And, we're not talking about centuries ago. This is the 1979 - 2000 average. A mere three decades ago people were able to walk across that gulf, but not any more.

This data all leads me to believe we have already witnessed the sea ice maximum extent for this year. Like I said, there are still a couple of weeks to go in the season so I might be wrong. Hopefully, I am. Because if I'm right, the sea ice extent is not only much smaller this year, but it is also much thinner and we might be facing a bad melt season.

Stay tuned.


Friday, February 13, 2015

Stormy Arctic

I read an excerpt from a new book on storms in the Arctic and the all of the associated effects. It was an interesting read and really made some excellent points. The Arctic is warming and it is warming faster than any other region of the planet. The author, Edward Struzik, states
Between 1951 and 2012, for example, temperatures in the region exceeded the freezing point an average of 110 days. In 2010 and 2011, they did so 127 times. In 2012, the warmest year on record in the Arctic, it happened 134 times.

Over the past two decades, the number of ice-free days averaged 80 per year. In 2012, there were 96 ice-free days that significantly accelerated the erosion that is already taking place.

The results of that warming are not good. Animal species, plants, wet lands and coastline are disappearing. Communities are falling into the ocean. And, storms are getting worse.


Reductions in sea ice are making Arctic storms more frequent and more severe. This is happening a number of ways. Sea ice traps humidity but as the ice melts the open water fills the atmosphere with moisture and is doing so earlier every year. This moisture then fuels storms that normally wouldn't occur before the fall but are now happening during the summer months. Also, the ice cover keeps storm waves from getting too intense. Now, waves and storm surges are getting bigger as the ice disappears. Rising sea levels are causing storm surges to travel ever further inland. And, ultimately, ice would pile up on the coast and protect it from the storm action, but that protection is now disappearing and the results are grim.

Struzik tells of towns disappearing in the Arctic region as the coastline erodes away - slowly, initially but at increasing rates. Coastlines that were loosing fewer than 7 meters per year in the 1950 - 1979 time period are loosing more than 25 meters per year today.

In case you are thinking, 'so what?', let me tell you the estimated engineering costs associated with all of this will be in the several hundreds of billions of dollars in just Alaska. That estimate comes from the U.S. Army Corps of Engineers and is only the cost of mitigation for about 60 coastal communities at risk of falling into the sea. Do you think the fossil fuel companies are going to pony up that money? Do you think the Koch brothers will donate any of their fortune? Don't count on it. The money for all of this will come from tax payer dollars. In other words, the American taxpayer will be paying for this.

Let's see. $100 billion dollars comes out to about $300 for every person in the country (bad news for a family of four!). And, the estimate is there will be 'several' billions of dollars of engineering costs. Where are those deniers that keep telling us global warming is good for us?

Canada does not come out very well in his account. Prime Minister Stephan Harper is a devoted anti-science advocate and has nearly shut down all science research in the country while actively trying to remove environmental regulations. Government scientists are prohibited from discussing their research with media. Government agents are sent to science conferences to monitor what Canadian scientists are saying.

Arctic research is being slashed, but the country then spent $300 million on a gravel road to a tiny village on the Arctic coast that will see only about $4.2 million in benefits from it. The people that will see the most benefit? Is there any surprise it is the fossil fuel industry that wants to build a natural gas pipeline through the area?

So, the Canadian government is shutting down research and instituting a Joe McCarthy policy, while spending hundreds of millions on a single road for the mega-wealthy fossil fuel companies. Too bad they didn't decide to spend that $300 million on research and let the fossil fuel companies build their own road.

Like I said, it is an interesting read. Not pleasant, but interesting.


Saturday, February 7, 2015

Arctic Sea Ice Video

This is a video showing the Arctic sea ice from 1987 through 2014. Someone said it looked like the ocean is vomiting ice and it does resemble that rather graphic description. You decide for yourself if the sea ice has recovered.


https://www.youtube.com/watch?feature=player_embedded&v=FDRnH48LvhQ


Wednesday, February 4, 2015

Sea Ice Variability and Cherry Picking

I read a report the other day that made several statements I found interesting. In fact, statements I think the data disputes.

Erratic as normal: Arctic sea ice loss expected to be bumpy in the short term states, "Arctic sea ice extent plunged precipitously from 2001 to 2007, then barely budged between 2007 and 2013."

Let's look at the data. Here is a plot of the Arctic sea ice extent as measured in September every year.


Source: NSIDC

What you can easily see is the downward trend in the extent, represented by the dashed line. Now, take a look at the two periods in question. First, the 2001 to 2007 data shows it went from about -10% to -35%. Then, the 2007 to 2013 period shows it went from -35% to -15%. Apparently, the data supports the conclusion of the paper's authors.

But, I contend this is what is known as cherry picking - picking your data points to give the results you are looking for. I have frequently criticized deniers for doing this and it is only fair to criticize scientists for doing it, as well. How do I justify calling it cherry picking? Well, let's take a look at some other starting and ending points.

If we examine the period 2001 to 2009, we get the ice extent went from about -10% to -15%. Now, if we examine the period of 2009 to 2012, we get the ice extent went from -15% to -45%. That is a completely different result! Using these data points, I can say the ice extent was fairly steady from 2001 to 2009 but dropped at an alarming rate from 2009 to 2012, opposite of the claims made in that paper. Again, it is all about picking your starting and ending points.

Since I have just accused the authors of cherry-picking, I find it very interesting when they state,
"To understand how climate change is affecting the Arctic, you cannot cherry pick short stretches of time," Kay said. "Seven years is too short."
In this regard, they are very correct and I am in agreement with them, but I still maintain they cherry picked the data to get the results they wanted. Using slightly different starting and ending points produces exactly opposite results.

That is why we must use long-term data and determine what the trend is. There is going to be a great deal of variability from year to year, not just in sea ice but in any kind of climate data we get. The climate is extremely complex, possibly the single most complex science of all. There is not just one thing at work, there is essentially every single field of physics at play. Everything from quantum mechanics and particle physics to space science and astronomy with everything in between is involved with climate science.It only stands to reason we should see variability in the short term and we need to focus our attention on the long term

As for any claim the Arctic sea ice is making a 'recovery,' take a look at this plot of the current sea ice:

Source: NSIDC
The dark line is the long term Arctic sea ice average extent. The khaki-colored line shows the data for 2014. The blue line is the data for 2015. The dark band is plus or minus two standard deviations from the long term average. You can see the current year is roughly the same as last year and both years were near the near the minus-two sigma border. 

There is no 'recovery' underway. The sea ice is disappearing and, even with yearly variability included, it continues to do so.


Saturday, December 20, 2014

If Arctic Sea Ice Is Recovering, Why Is Everyone Claiming Arctic Ownership?

One of the common false claims being made is that the Arctic sea ice has made a full recovery. The truth is that it is not even close. The 2013 melt season saw a large rebound (approximately 60%) over the 2012 melt season. However, that rebound was from an exceptionally low year. The minimum sea ice extent in 2012 was so low it was shocking. A large rebound from almost nothing is still a small amount overall. Then, the 2014 minimum extent was smaller than the 2013 and approximately 40% below the 1980 level (which was large). The trend line is very clear, the Arctic sea ice extent is decreasing. Still, the claims come in, mostly by people that don't want to bother with the facts.

But, there has been a trend over the last few years that is very difficult for anyone to deny - oil businesses are moving into the Arctic Region. This would not be possible with previous ice extent. The only way it is at all possible to erect drilling rigs in the Arctic is if the ice is melting away. If you set-up on top of the ice, the drifting ice would tear you away from the drill hole. It would not be possible to get a ship through the ice to drill and, even if you did, the drifting ice would push the ship out of position. For the same reason, it would not be possible to erect a drilling platform. The ice would demolish it. The Arctic Ocean, on average, is about 1000 meters deep (about 3200 feet) with a maximum depth of 5500 meters (18,000 feet). The deep parts of the ocean are too deep for a platform, but the shallow areas could accommodate one, but only in the absence of massive, drifting ice flows. If millions of tons of moving ice hit a platform, the ice is going to win.

But, wait. Companies are actually drilling up there and making claims so they can drill in the future. The U.S., Norway, Denmark, Canada and Russia have all made claims to ownership of some part of the Arctic Ocean basin. Denmark and Russia have claimed ownership of the North Pole itself.


So, if it is impossible to drill in the Arctic Ocean with ice present, why are the companies drilling? Clearly, claims the ice extent is fully recovered are all wrong. And, that makes you wonder about the motive for people to make claims that are obviously false.


Saturday, November 22, 2014

Polar Bear Numbers Decreasing

The polar bear, as we all know by now, has become the symbol of the argument over climate change. The bears were put on the threatened species list in 2008, despite the fact that their population was quite robust. The rationale for that decision is because the Arctic sea ice is decreasing and is at risk of disappearing completely during the summer months within a few decades. Since the bears spend most of their lives on the ice, this would constitute habitat loss for them and that would threaten their population due to their lack of hunting areas. This decision led to a firestorm of comments from the climate change crowd and even lawsuits. The argument has been clouded by the fact that additional counting methods have been introduced that seem to show the population is increasing.

Now, more data is coming in showing there is a lot of stress on the population. Before I continue, I am not going to say the polar bear is at risk of extinction anytime soon. Some of the 19 identified sub-populations are at risk, but not the species. There are approximately 25,000 polar bears in the Arctic, so the species is not at immediate risk.

Having said that, the trend of the polar bear population is becoming pretty clear - it is declining and we can expect even more decline in the future.

A scientific paper published in the Ecological Society of America journal Ecological Applications states the Beaufort Sea sub-population decreased by 40% between 2000 and 2010, from 1500 bears in 2001 to only 900 in 2010. Studies of all 19 sub-populations is not possible due to the remoteness of some of them and a lack of funding, but studies of 10 of the sub-populations has shown the population to be decreasing in four of them, stable in five of them and increasing in one. The population as a whole is decreasing.

The additional pressure on the population is highlighted by the situation this fall in Churchill, Manitoba, Canada. Churchill is a gathering place for one of the sub-populations in the fall as Hudson Bay begins to freeze over. They use this area as their shoving off point to go out and hunt seals and other high calorie food they need to survive the harsh winter. Except, this year there was no ice. About 800 polar bears gathered and found there was no way for them to get to their food supply. To see what this means, the size of this sub-population was about 1200 just 30 years ago. The population has dropped by one-third in only 30 years, even though there are new laws to protect them from hunting. There is legitimate fear this sub-population may disappear completely within as little as ten years.

As of today, Hudson Bay has still not frozen in the area of Churchill. Take a look at this map of the sea ice extent:
Source: Climate Change Institute

The light blue line shows the average sea ice extent for this date. Churchill is located about one-half of the way up the left side of the bay, right where there is a sharp jut-out and a little below the borderline that is shown. As you can see, this area is supposed to be iced-over by now, but it isn't. That is bad news for the bears waiting to go hunting.

Now, ask yourself, how would you like to be trapped in an area with 800 hungry polar bears? Do you think that if you were, you would come to the conclusion that climate change is not such a good idea?


Monday, September 22, 2014

NASA/NSIDC Statement On Sea Ice Minimum

NASA and NSIDC have confirmed that this year's Arctic sea ice minimum was the sixth lowest on record. Read the statement here.


Monday, September 15, 2014

2014 Arctic Sea Ice Extant Now Sixth Lowest Ever

According to data from the National Snow and Ice Data Center, the Arctic sea ice extent has now reached a low of 5.082 million square kilometers and is still declining. That is now less than the minimum extent of 5.101 million square kilometers recorded in 2013. In addition to 2013, the 2014 level is also lower than than the 2009 level. The only years with less ice than what we are seeing right now are 2007, 2008, 2010, 2011 and the disastrous year of 2012. It would take a major event for the 2014 level to fall to the level of any of those years, so it looks like 2014 will go down as having the sixth lowest Arctic sea ice level ever recorded. The minimum should be reached within the week (last year's minimum occurred on September 14th) and we will know for sure.

This is bad news all around. It was certainly hoped that the big rebound that occurred last year might be the start of a trend, but the data doesn't support that. While the hope might have been there, no one studying the Arctic sea ice thought a new trend would occur. The science and the history both indicated last year's extent was nothing more than a fluctuation in the weather and not a recovery.

This, of course, is also bad news for all of the deniers and contrarians out there that have been making claims that global warming isn't real because the sea ice has recovered to the highest level in 35 years/1980 levels/full level/record level, take your pick of the false claim (I have heard all of these and even more).

No, the sea ice extent is not recovering and claims to the contrary are not supported by science. But, isn't that typical for the contrarians? Never let good science get in the way of your claims.

I will be making a more detailed posting on this year's ice (including Antarctica and Greenland) after we hit the minimum extent in the Arctic.